Felicittina 🤨⁉️🔎±φ Profile picture
Nov 14, 2021 14 tweets 8 min read Read on X
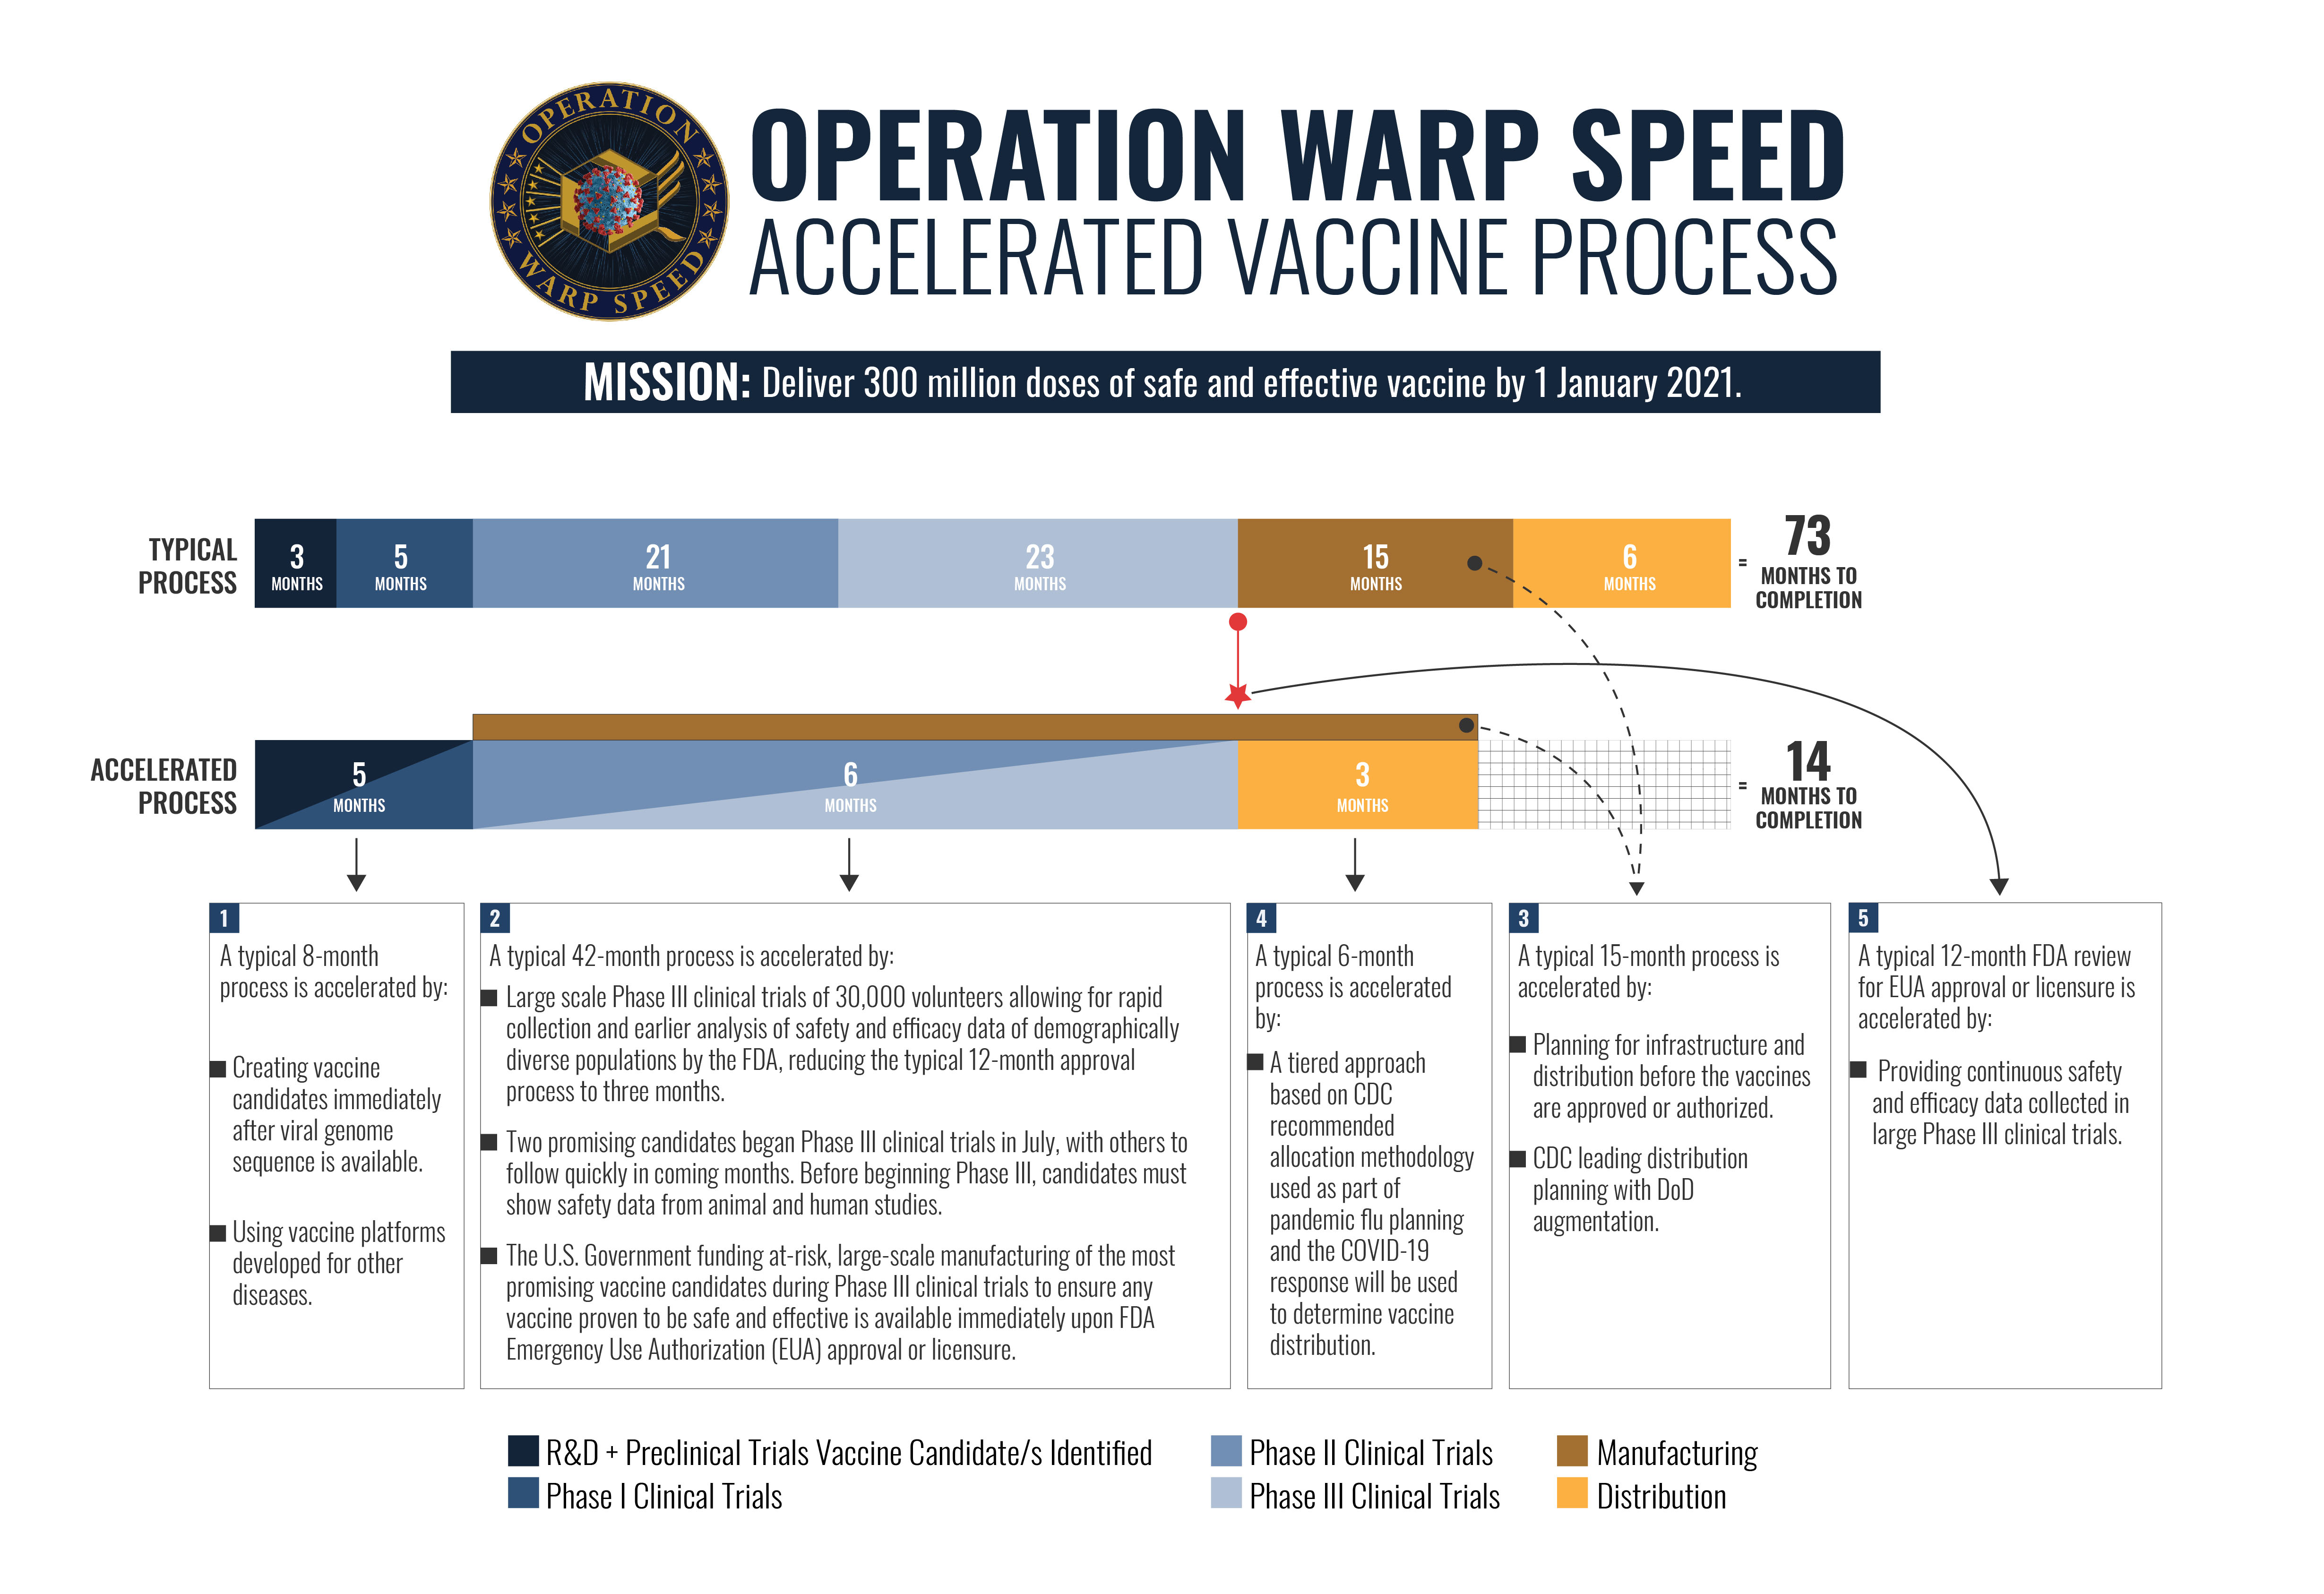
1. "Operation Warp Speed" or how to develop'n produce vaccine in 14 months instead of 73.
With 14 months timeline ending on 1/1/2021🧐🗓️
We should probably read april, but that's a detail…
media.defense.gov/2020/Aug/13/20… Image
2. 12-month FDA review is replaced by a continuous control of safety and efficacy data.
It really must have been a tremendous work to inspect hundreds of trial sites and dozens of manufacturing units… Image
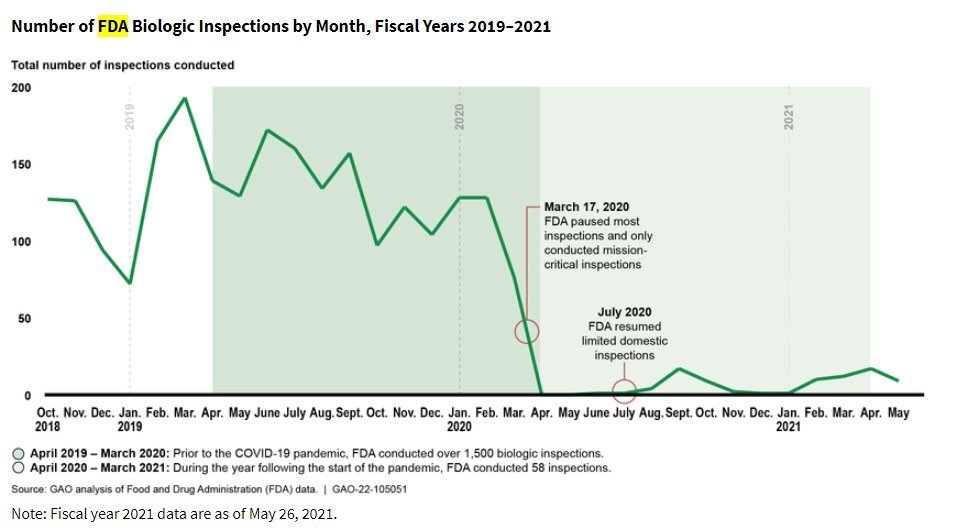
3. But this @USGAO report tells us that only 58 #FDA biological inspections were conducted from April 2020 to March 2021, up from 1,500 in the previous 12 months. <30 before December.
files.gao.gov/reports/GAO-22… Image
4. Among these inspections, we find, for the 33 Covid vaccine sites: 2 Moderna sites, 2 Janssen, 1 Novavax, 1 GSK.
None for Pfizer after mid-2019.
Completed by 7 EUA investigations and 2 site visits.
Amply sufficient, right? Image
5. But guess who's the designer of Operation Warp Speed?
Dr Peter Marks, top vaccine regulator for FDA.
Responsible for safety and… on-time delivery, with help from Pentagon. Quite the job!
nytimes.com/2020/11/21/us/… Image
6. Because, for #Trump, the priority is to announce the vaccine before November election.
It will be missed by a few days🤏🏼
#Bourla and #Bancel probably had nothing to gain from having their results acclaimed by a campaigning president.
A little discretion couldn't hurt.🐾 Image
7. The @nytimes paper also describes how Pfizer broke away from standard testing rules by consulting the data too early and too often. Image
8. So when @USGAO's report shows a heartbreakingly reduced level of control, shouldn't we consider that #FDA just acted as an auxiliary of #Pfizer & #Moderna, with no right to failure, seemingly.
9. Is the #Ventavia affair revealed by the #BMJ only a rotten apple in a big basket or a patch that drops on the wall of a toxic sludge tank?
And this only concerns clinical trials, not vaccine production conditions🧐 bmj.com/content/375/bm…
10. As for the 9 RCT inspections quoted by the BMJ investigation, if someone manages to find them in the #FDA base, they are really well hidden. I could not.
datadashboard.fda.gov/ora/cd/inspect…
Please note, the @nytimes article is not open access.
You can try it out via the @waybackmachine :
web.archive.org/web/2020112512…
Thanks for Retweets!🙏🏼
🇫🇷Threads originaux disponibles en français :

• • •

Missing some Tweet in this thread? You can try to force a refresh
 

Keep Current with Felicittina 🤨⁉️🔎±φ

Felicittina 🤨⁉️🔎±φ Profile picture

Stay in touch and get notified when new unrolls are available from this author!

Read all threads

This Thread may be Removed Anytime!

PDF

Twitter may remove this content at anytime! Save it as PDF for later use!

Try unrolling a thread yourself!

how to unroll video
  1. Follow @ThreadReaderApp to mention us!

  2. From a Twitter thread mention us with a keyword "unroll"
@threadreaderapp unroll

Practice here first or read more on our help page!

More from @felicittina

Mar 2
1. NO! , you do NOT have the right to disguise the excess deaths in #Japan since 2023, based on ‘expected’ deaths 🔴 up by... +14.5%.
That's called fraud!
⏬ (1/n) exdeaths-japan.orgTrends in all-cause mortality in Japan from 2010 to 2024. From 2022 onwards, the figures greatly exceed the multi-year trend. 'Expected’ deaths, calculated by the official organisation exdeaths-japan.org, have jumped by +14.5% since 2022 in order to mask excess mortality.
2. And indeed, when you look at the result of their calculations since March 2023, you see that most of the bars🟦, showing observed deaths, remain well below the dashed line, showing ‘expected’ deaths.
exdeaths-japan.org/en/graph/weekl…Le site exdeaths-japan.org ne rapporte aucune surmortalité depuis mars 2023 mais plutôt une sous-mortalité quasi constante.
3. To the naked eye, the change in "expected" deaths may seem insignificant, but let's download these data and average them over the first 47 weeks available from 2017 to 2024.

The jump in these 'expected' deaths between 2022 and 2024 is +14.5%. 🚀 exdeaths-japan.org/data/Estimates…Image
Read 10 tweets
Mar 1
1. NON ! , vous n'avez pas le droit de camoufler les surmortalités au Japon depuis 2023, en vous appuyant sur des décès "attendus" 🔴en hausse de… +14,5%.
Cela s'appelle une fraude !
⏬ (1/n) exdeaths-japan.orgEvolution des mortalités toutes causes au Japon de 2010 à 2024. Les valeurs excèdent largement la tendance pluri-annuelle à partir de 2022. Les décès "attendus", calculés par l'organisme officiel exdeaths-japan.org ont bondi de +14,5% depuis 2022 afin de masquer les surmortalités.
2. Et effectivement, quand vous regardez le résultat de leurs calculs depuis mars 2023, vous constatez que la plupart des barres🟦, montrant les décès observés, restent bien en dessous de la ligne tiretée, montrant les décès "attendus".
exdeaths-japan.org/en/graph/weekl…Le site exdeaths-japan.org ne rapporte aucune surmortalité depuis mars 2023 mais plutôt une sous-mortalité quasi constante.
3. A l'oeil nu, l'évolution des décès "attendus" peut paraître anodine, mais téléchargeons ces données et faisons les moyennes pour les 47 premières semaines disponibles de 2017 à 2024.

Le bond de ces "expected" est de +14,5% entre 2022 et 2024 exdeaths-japan.org/data/Estimates…Image
Read 10 tweets
Feb 20
Focus sur les #français nés en 1947 et ce qui leur arrive depuis 2020.
Cette année a la particularité d'avoir le + haut taux de natalité depuis 1920, à 21,4‰.
Alors que 2024 vient de descendre à 9,5‰, battant le triste record (vers le bas) de… 1916 !
[1/7] Image
Les natifs de 1947 ont aussi été les derniers à bénéficier d'une pension de retraite calculée sur les 10 meilleures années de salaire.
Sauf que là, ils ont chargé avec près de 1% de leur population qui a disparu de manière inattendue, dont les 2/3 depuis 2022.
[2/7]
On est quasiment dans un scénario à la #Leftovers, cette série TV où 2% de la population mondiale a disparu en un instant.
Sauf que là, il faut faire comme si rien ne s'était passé et surtout comme si rien ne continuait à se produire.
Encore moins crédible comme scénario !
[3/7] Image
Read 9 tweets
Feb 18
La #France ne semble finalement pas débarassée de ses problèmes de #surmortalité si on se réfère aux taux de mortalité standardisés qui éliminent l'essentiel des biais liés à l'évolution démographique.
Mais c'est pire si on élargit la vision…

[1/15] Image
…le tableau devient en effet encore + alarmant, car la période 2015-2019 semble déjà correspondre à un premier épisode de surmortalité.
[2/15] Image
C'est particulièrement visible si on compare les taux des années 2015-2019 à la tendance 2000-2014.
Notez également le pic correspondant à la canicule de 2003 et comme il a été en grande partie effacé dès l'année suivante.

[3/15] Image
Read 17 tweets
Feb 1
La #France ne semble finalement pas débarassée de ses problèmes de #surmortalité si on se réfère aux taux de mortalité standardisés qui éliminent l'essentiel des biais liés à l'évolution démographique.
Mais c'est pire si on élargit la vision…

[1/9] Image
…le tableau devient en effet encore + alarmant, car la période 2015-2019 semble déjà correspondre à un premier épisode de surmortalité.
[2/9] Image
C'est particulièrement visible si on compare les taux des années 2015-2019 à la tendance 2000-2014.
Notez également le pic correspondant à la canicule de 2003 et comme il a été en grande partie effacé dès l'année suivante.

[3/9] Image
Read 15 tweets
Jan 25
🇬🇧 Incredible statistics from #England & #Wales!
According to the @ONS, they have experienced an UNDER-MORTALITY of -8.3% in 2024!
And nobody's talking about it, how fabulous it is?
It's quite clear, let me explain...
[1/12] Image
@ONS Let's zoom in🔎
For @ONS, the expected evolution of deaths was supposed to follow the curve 🔴 (615k for 2024).
But we got the value 🟦 (569k).
And there you have it, 8.3% less than expected.
This is real science with detailed methodology, bibliography and all...
[2/12] Image
@ONS This can be seen clearly on their graph, where the bars are consistently well below the dark blue marks for 2024.
Src:
[3/12] ons.gov.uk/peoplepopulati…Image
Read 12 tweets

Did Thread Reader help you today?

Support us! We are indie developers!


This site is made by just two indie developers on a laptop doing marketing, support and development! Read more about the story.

Become a Premium Member ($3/month or $30/year) and get exclusive features!

Become Premium

Don't want to be a Premium member but still want to support us?

Make a small donation by buying us coffee ($5) or help with server cost ($10)

Donate via Paypal

Or Donate anonymously using crypto!

Ethereum

0xfe58350B80634f60Fa6Dc149a72b4DFbc17D341E copy

Bitcoin

3ATGMxNzCUFzxpMCHL5sWSt4DVtS8UqXpi copy

Thank you for your support!

Follow Us!

:(