Tencent $TCEHY 3Q21 Earnings
- Rev ¥142b +13% ↗️
- Gross Profit ¥62.8b +11% ↗️ margin 44% -108bps ↘️
- EBITDA ¥49.3b +3% margin 35 % -354bps ↘️
- EBIT ¥40.8b +7% ↗️ margin 29% -171bps ↘️
- Net Income ¥32.5b -2% ↘️ margin 23% -372bps ↘️
- FCF ¥24b -14% ↘️ margin 17% -548bps ↘️
- Rev ¥142b +13% ↗️
- Gross Profit ¥62.8b +11% ↗️ margin 44% -108bps ↘️
- EBITDA ¥49.3b +3% margin 35 % -354bps ↘️
- EBIT ¥40.8b +7% ↗️ margin 29% -171bps ↘️
- Net Income ¥32.5b -2% ↘️ margin 23% -372bps ↘️
- FCF ¥24b -14% ↘️ margin 17% -548bps ↘️
Business Metrics ↗️
- VAS Rev ¥75b +8% ↗️
- Domestic Game Rev ¥34b +5% ↗️
- Int Game Rev ¥11b +20% ↗️⭐️
- Social Network Rev ¥30b +7% ↗️
- Online Ad Rev ¥23b +5% ↗️
- Social Ad ¥19b +7% ↗️
- Media Ad ¥4b -4% ↘️
- FinTech Rev ¥43b +30% ↗️⭐️
- VAS Rev ¥75b +8% ↗️
- Domestic Game Rev ¥34b +5% ↗️
- Int Game Rev ¥11b +20% ↗️⭐️
- Social Network Rev ¥30b +7% ↗️
- Online Ad Rev ¥23b +5% ↗️
- Social Ad ¥19b +7% ↗️
- Media Ad ¥4b -4% ↘️
- FinTech Rev ¥43b +30% ↗️⭐️
Operating Metrics 📶
- MAU (Weixin & WeChat) 1.3b +4% ↗️ +1%QoQ ↗️
- VAS Subs 235m +10% ↗️ +2%QoQ ↗️
- Mobile MAU (QQ) 574m -7% ↘️ -3% QoQ ↘️
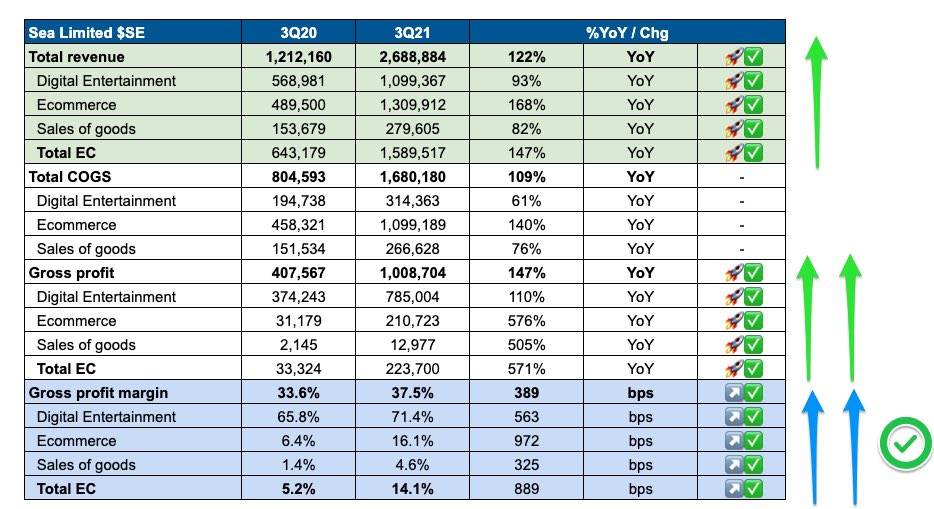
⭐️ Invested Shareholdings ¥1,197bn ($185bn) now ~¼ of mkt cap, with $MPNGY, $SE, $PDD, $JD ~60% of that.
- MAU (Weixin & WeChat) 1.3b +4% ↗️ +1%QoQ ↗️
- VAS Subs 235m +10% ↗️ +2%QoQ ↗️
- Mobile MAU (QQ) 574m -7% ↘️ -3% QoQ ↘️
⭐️ Invested Shareholdings ¥1,197bn ($185bn) now ~¼ of mkt cap, with $MPNGY, $SE, $PDD, $JD ~60% of that.
1 | Key Focus Areas
- Proactively embrace new reg environment
- Commit to common prosperity initiatives, contributing to society
- More sustainable development path
- Comply with new regs significantly reducing minors’ game time & spent, fostering healthier gameplay environment
- Proactively embrace new reg environment
- Commit to common prosperity initiatives, contributing to society
- More sustainable development path
- Comply with new regs significantly reducing minors’ game time & spent, fostering healthier gameplay environment
2 | Minors are insignificant now…
- Time Spent: 0.7% in Sep21 ↘️ from 6.4% in Sep20.
- Gross Receipts: 1.1% in Sep21 ↘️ from 4.8% in Sep20.
- Time Spent: 0.7% in Sep21 ↘️ from 6.4% in Sep20.
- Gross Receipts: 1.1% in Sep21 ↘️ from 4.8% in Sep20.
3 | Soft Advertising - Soft still, rebase in 2022…⤴️
“We expect advertising pricing industry wide may remain soft for several quarters due to macro challenges and regulations affecting certainty advertising sectors.
“We expect advertising pricing industry wide may remain soft for several quarters due to macro challenges and regulations affecting certainty advertising sectors.
3 | Soft Advertising - Soft still, rebase in 2022…⤴️
“We believe the advertising industry should adjust and rebase during 2022 then resume growth, the secular growth drives reassert themselves.”
“We believe the advertising industry should adjust and rebase during 2022 then resume growth, the secular growth drives reassert themselves.”
4 | Strong Growth in FinTech due to ↗️ Payment Volume
“Within fintech services YoY revenue growth was mainly driven by increased commercial payment volume with healthy growth in categories such as groceries, power and transportation, commercial payment…”
“Within fintech services YoY revenue growth was mainly driven by increased commercial payment volume with healthy growth in categories such as groceries, power and transportation, commercial payment…”
5 | Tencent to return back to double digit growth in 2022? 

6 | Tencent - Truly a business with solid long-term profitability 💪🏻

7 | With -35% decline from ATH, perhaps Tencent share price is looking oversold relative to its strong business fundamentals? 🤔
Love this chart of rising revenues, profits and share price btw 📈.
“In the ST, Mr Market is a voting machine,
in the LT it is a weighing machine.”
Love this chart of rising revenues, profits and share price btw 📈.
“In the ST, Mr Market is a voting machine,
in the LT it is a weighing machine.”

Final Takeaways on Tencent $TCEHY:
➡️ Still doing fine. Smaller reg headwinds, next few quarters to stay soft, likely rebase in 2022 for reacceleration. Combination of growth, profitability, optionality and the strong moat of network effects. Investment thesis remains unchanged.
➡️ Still doing fine. Smaller reg headwinds, next few quarters to stay soft, likely rebase in 2022 for reacceleration. Combination of growth, profitability, optionality and the strong moat of network effects. Investment thesis remains unchanged.
• • •
Missing some Tweet in this thread? You can try to
force a refresh