UPDATED briefest possible explanation of CO₂ #climatechange physics:

(1/12) Any warm object radiates energy at wavelengths depending on its temperature, the distribution of which is described by Planck's Law:
2. The sun's surface temperature is 5,778 K, so Planck's Law predicts it will radiate primarily at visible light wavelengths. Image
3. Earth receives 1,362 W/m² from the sun in a combination of UV, visible and infrared radiation, but 29.5% is immediately reflected by clouds or the surface. The remaining 70.5% (960 W/m²) is absorbed by land, air and oceans.
4. The sun illuminates the disk of Earth (area = πr²) but our spherical plant has an area = 4πr². To maintain energy equilibrium and steady surface temperature, the average square meter of Earth's surface must emit 240 W/m² (960 W/m² ÷ 4 = 240 W/m²). Image
5. From the Stefan-Boltzmann Law, we can calculate the surface temperature that will radiate exactly 240 W/m² (255 K). If we plug this temp. back into Planck's Law, we calculate that Earth will glow in a distribution of wavelengths mostly in thermal infrared (4-50 μm). Image
6. This would be the case if Earth had no atmosphere. Instead, greenhouse gasses (GHGs) absorb & re-radiate Earth's outgoing infrared, producing a jagged emission to space.
7. IR-active GHGs suppress emission in some portions of the spectrum, requiring surface warming of about +33 K to maintain 240 W/m² of outgoing thermal infrared (equilibrium with the sun). But the warmer surface now emits 390 W/m², 150 W/m² more than it would without GHGs. Image
8. This +33 K warmer surface temperature and the additional 150 W/m² thermal infrared is the greenhouse effect (GHE). Human additions of CO₂, CH₄, and other minor gasses have further increased this by ~3 W/m² so far. Image
9. How much warming does +3 W/m² produce?
•Easier part is calculating effects from infrared absorption alone.
•Harder part is how clouds, ice, and vegetation respond. Clouds and ice reflect a lot of sunlight, while trees absorb it. Climate models don't agree on these feedbacks. Image
10. Consequently, warming estimates have historically varied over a wide range: 1.0-6.0°C per doubling of CO₂ (Knutti-2017). Recently the IPCC AR6 report has concluded there is enough evidence to tighten this range to 2.5-4.0°C. Image
11. Future warming also depends on how quickly & how much more GHG's are added. While some have feared worst-case-scenarios RCP8.5 or SSP5-8.5, current emissions projections much more modest (dire media headlines are usually based on RCP8.5 studies) Image
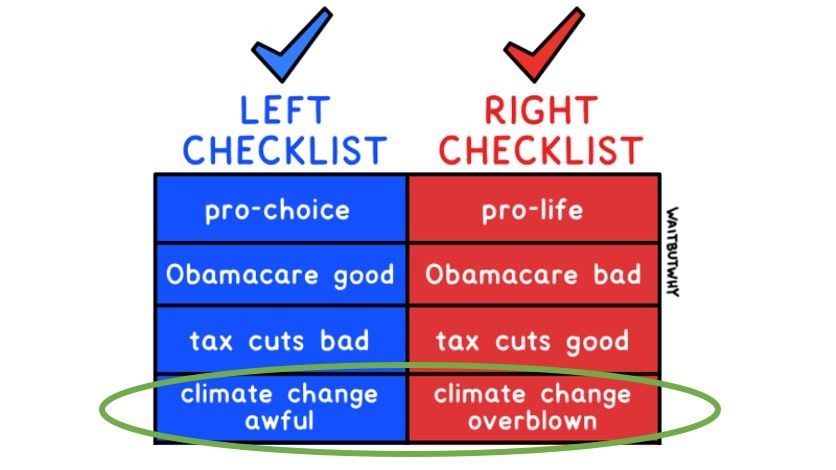
12. Any campaign to change the status quo may tend to construct two simple, clear-cut categories: pro- and anti-climate action. In fact, Americans can be categorized according to at least six levels of concern regarding climate change: Image
As usual, my goal is 100% accuracy. If something is incorrect, feel free to let me know.

• • •

Missing some Tweet in this thread? You can try to force a refresh
 

Keep Current with Chris Rentsch

Chris Rentsch Profile picture

Stay in touch and get notified when new unrolls are available from this author!

Read all threads

This Thread may be Removed Anytime!

PDF

Twitter may remove this content at anytime! Save it as PDF for later use!

Try unrolling a thread yourself!

how to unroll video
  1. Follow @ThreadReaderApp to mention us!

  2. From a Twitter thread mention us with a keyword "unroll"
@threadreaderapp unroll

Practice here first or read more on our help page!

More from @crentsch

6 Oct
100% consensus light travels 186,000 mph
⤷ because we can measure it

100% consensus that 𝑔 = 6.67...x10⁻¹¹ Nm²/kg²
⤷ because we can measure it

97% consensus that ↑CO₂ changes climate
...because CO₂ radiative forcing isn't measured

Measurement supersedes a consensus.
I'm ~not~ saying the climate consensus is wrong. I'm explaining why we even ~talk~ about a consensus.

With no direct CO₂ forcing measurement, climatologists study indirect effects like 🌡️ ocean heat content or 📉 stratosphere instead.
The effect of aerosols, ozone, ⛅️ & 🌋 are all accounted for, then what's left over is then attributed to increased CO₂, even though CO₂ radiative forcing wasn't directly measured (it was modeled w/computers).
Read 7 tweets
30 Nov 20
Over the last 14 months I have been refining the briefest possible explanation of CO₂ #climatechange physics:

(1/15) Any warm object radiates energy at wavelengths depending on its temperature. The distribution of wavelengths is described by Planck's Law:
2. Planck's Law predicts that the Sun, having a surface temperature of 5,800 degrees, will radiate mostly at visible light wavelengths.
3. The sun-facing side of Earth receives 1,362 W/m² in a combination of visible and infrared radiation.
Source: Kopp & Lean doi.org/10.1029/2010GL…
Read 16 tweets
28 Jul 20
I went through the technical guide for a modern climate model and counted the user-specified parameters:

1,737 (and I know I missed some).

If you've ever wondered what dials must be set to run a GCM, here they are...🧵
I have been told 'these just physics simulators' suggesting that after entering π, σ, 𝑔, etc and some earth-specific information, the rest is simply the consequence of laws of nature. I would observe this is not entirely the case.
First, the model needs 207 plant optical properties specifying the IR/vis reflectance and absorbance of leaves and stems
Read 54 tweets
22 Mar 20
Stuck indoors, lots of time to read, currently finishing Brandt's book on Dow Chemical's first 100 years.

The strangest/craziest stories inside👇 Image
1. Herbert Dow visited the bromine plant and "I found it shut down with most of the men on the roof. The coke tower was plugged with iron hydrate and needed to be scraped out. But, there was considerable odor of bromine and the men claimed they were waiting for it to clear up...
I was satisfied that the amount of bromine was not more than it had been customary for me to soak up on many occasions and I presumed the foreman was equally familiar with the amount of bromine the men could absorb without injury. So I told him to set the example by going down...
Read 17 tweets
19 Jan 20
People don't use data to decide what to think 🧐

At best they may use data to update existing beliefs

Have you ever discussed climate data with someone, only to arrive at opposite conclusions?

There is interesting math behind why. [1/11]
img: @waitbutwhy
In the Bayesian framework, how much you believe something after you see the evidence depends not just on what the evidence shows, but on how much you believed it to begin with. The posterior is affected not only by the evidence you encounter, but also by your prior. [2/11]
Here are 5,498 temperature anomalies from Berkeley Earth's 2019 dataset. Natural variable weather ensures that any individual station reports higher or lower temperatures in a somewhat random fashion. [3/11]
Read 12 tweets
15 Dec 19
How does mainstream climate change science arrive at CO₂ = catastrophic warming?

Nobody is reading thousand-page IPCC reports. People just trust headlines, actors, etc.

I'm not that trusting For myself I had to create this primer to connect it all together. [0/n]
Any warm object radiates energy at wavelengths depending on its temperature. The distribution of wavelengths is described by Planck's Law. [1/n]
Planck's Law predicts that the Sun, having a surface temperature of 5,800 degrees, will radiate mostly at visible light wavelengths. [2/n]
Read 15 tweets

Did Thread Reader help you today?

Support us! We are indie developers!


This site is made by just two indie developers on a laptop doing marketing, support and development! Read more about the story.

Become a Premium Member ($3/month or $30/year) and get exclusive features!

Become Premium

Too expensive? Make a small donation by buying us coffee ($5) or help with server cost ($10)

Donate via Paypal

Thank you for your support!

Follow Us on Twitter!

:(