People don't use data to decide what to think 🧐
At best they may use data to update existing beliefs
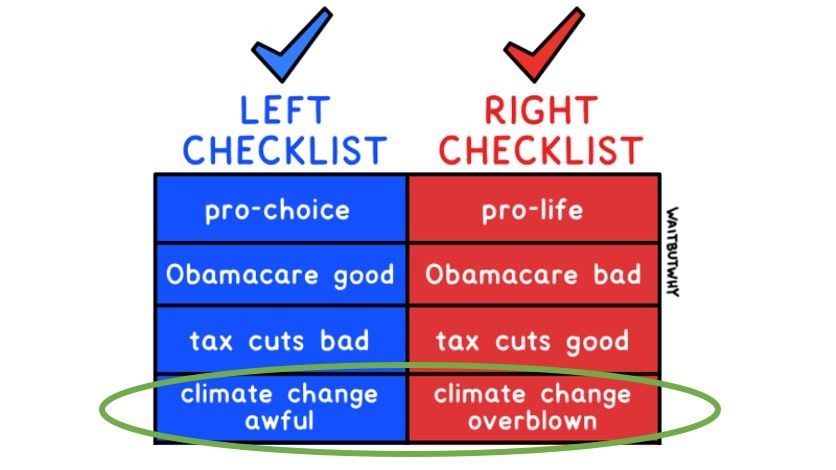
Have you ever discussed climate data with someone, only to arrive at opposite conclusions?
There is interesting math behind why. [1/11]
img: @waitbutwhy
At best they may use data to update existing beliefs
Have you ever discussed climate data with someone, only to arrive at opposite conclusions?
There is interesting math behind why. [1/11]
img: @waitbutwhy
In the Bayesian framework, how much you believe something after you see the evidence depends not just on what the evidence shows, but on how much you believed it to begin with. The posterior is affected not only by the evidence you encounter, but also by your prior. [2/11]

Here are 5,498 temperature anomalies from Berkeley Earth's 2019 dataset. Natural variable weather ensures that any individual station reports higher or lower temperatures in a somewhat random fashion. [3/11]

A LaPlace distribution of 5,498 random samples (μ=1.06, β=1.1) gives a fair approximation to the temperature anomalies.
LaPlace distributions are already in climatological use for estimating 100-year rainfall events 🌧️🌧️ [4/11]
LaPlace distributions are already in climatological use for estimating 100-year rainfall events 🌧️🌧️ [4/11]
For this probability distribution, a very high temperature event (e.g., monthly temperature >3.1C above average) is much rarer than a more typical ±1.6 degrees of average. [5/11]

+3.1°C is exactly two standard-deviations higher than average expected to occur only 3% of the time by random chance. But after +1°C global warming that chance more than doubles to 7.4%. [6/11]

Suppose there are only two possibilities:
📈Climate is sensitive to human greenhouse gasses and temperatures are warming in response to emissions (AGW)
📊Climate warms and cools more or less randomly. Incremental GHG impacts are minor compared to other drivers (NOT-AGW)
[7/11]
📈Climate is sensitive to human greenhouse gasses and temperatures are warming in response to emissions (AGW)
📊Climate warms and cools more or less randomly. Incremental GHG impacts are minor compared to other drivers (NOT-AGW)
[7/11]

An observer may acquire a bit of bias when they see a starving polar bear or read a climategate email. Suppose we have:
• Left: 85% sure AGW/15% NOT-AGW
• Right: 15% sure AGW/85% NOT-AGW
These are the priors for two groups. Each prior is an (expectation*probability).
• Left: 85% sure AGW/15% NOT-AGW
• Right: 15% sure AGW/85% NOT-AGW
These are the priors for two groups. Each prior is an (expectation*probability).

Our two biased observers encounter some evidence: a news agency has reported a region experienced an exceptionally high temperature anomaly 🔥 +3.1°C above average. [9/11]

In this case only the top row applies. Both observers compute their posterior probability ratio:
• The left concludes AGW is 𝟭𝟰𝘅 𝗮𝘀 𝗹𝗶𝗸𝗲𝗹𝘆 as likely as NOT-AGW.
• The right concludes NOT-AGW is 𝗺𝗼𝗿𝗲 𝘁𝗵𝗮𝗻 𝘁𝘄𝗶𝗰𝗲 𝗮𝘀 𝗹𝗶𝗸𝗲𝗹𝘆 as AGW. [10/11]
• The left concludes AGW is 𝟭𝟰𝘅 𝗮𝘀 𝗹𝗶𝗸𝗲𝗹𝘆 as likely as NOT-AGW.
• The right concludes NOT-AGW is 𝗺𝗼𝗿𝗲 𝘁𝗵𝗮𝗻 𝘁𝘄𝗶𝗰𝗲 𝗮𝘀 𝗹𝗶𝗸𝗲𝗹𝘆 as AGW. [10/11]

"That may seem troubling. Isn't science supposed to be objective? You'd like to say that your beliefs are based on evidence alone, not on some prior preconceptions you walked in the door with. But no one actually forms their beliefs this way." -Jordan Ellenberg [11/11]

If you're in a stalemate climate debate, try starting a conversation around your respective priors.
As usual, if you find anything factually incorrect in this thread please let me know. My goal is complete accuracy.
As usual, if you find anything factually incorrect in this thread please let me know. My goal is complete accuracy.