U.S. corporations have higher profits than ever before.
Profits ⬆️ 17% in the last 2 years.
Profits ⬆️ 17% in the last 2 years.

U.S. equity investors enjoying record high stock market, consistent with record high expected future profits ahead.
Wilshire Total Market Full Cap Index ⬆️ 58% in the last 2 years.
Wilshire Total Market Full Cap Index ⬆️ 58% in the last 2 years.

U.S. workers have more job opportunities than ever on record.
In recent months, more openings in total or as a share of jobs than ever before in records back to two decades.
Job opening rate ⬆️47% in last 2 years, compared to pre-pandemic Sept 2019.
In recent months, more openings in total or as a share of jobs than ever before in records back to two decades.
Job opening rate ⬆️47% in last 2 years, compared to pre-pandemic Sept 2019.

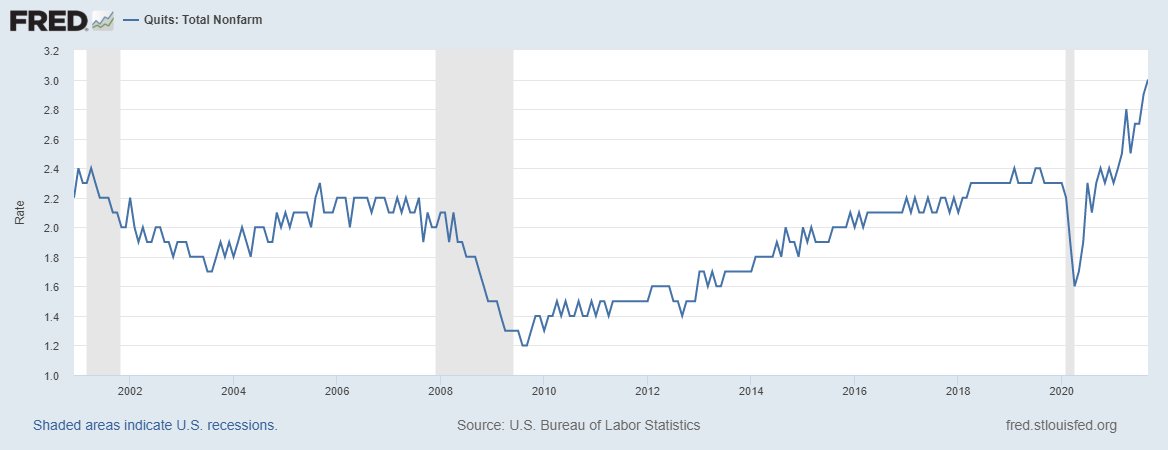
U.S. workers voluntarily choosing to quit their jobs for better options elsewhere at record rate, most in two decades.
Quit rate⬆️30% over last 2 years.
Bosses hate it but it means that workers judge they have better options elsewhere.
Quit rate⬆️30% over last 2 years.
Bosses hate it but it means that workers judge they have better options elsewhere.
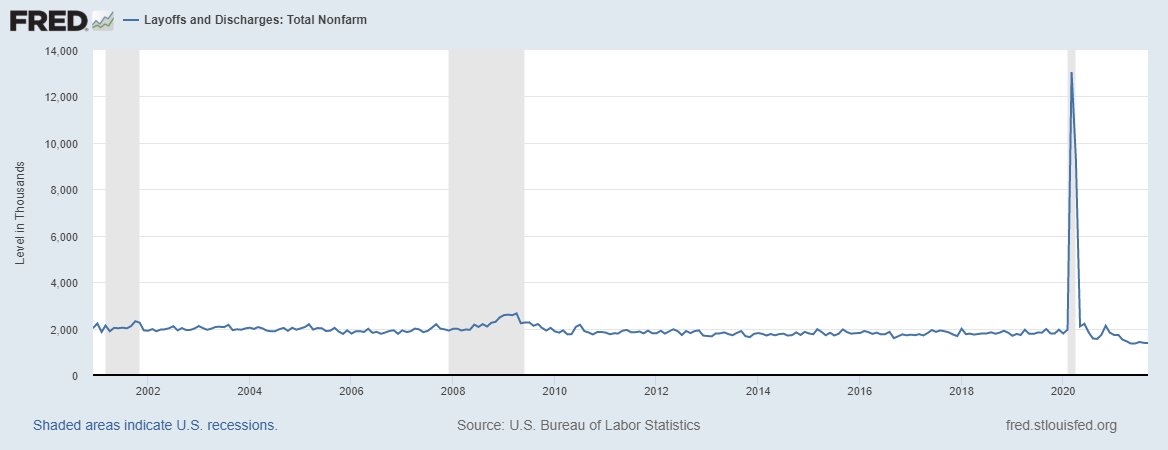
U.S. workers being discharged or laid off from their jobs by their bosses at record low rate, lowest in two decades.
Rate of (discharge or lay off) ⬇️31% from 2 years ago.
Rate of (discharge or lay off) ⬇️31% from 2 years ago.
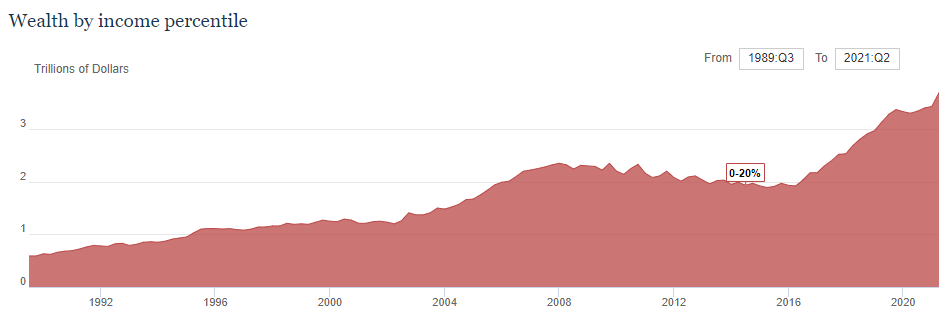
Average family wealth is at a record high for the 20% of families with the lowest incomes.
Net wealth ⬆️ 18% over the last 2 years.
Net wealth ⬆️ 18% over the last 2 years.
Average family wealth is at a record high for the next 20% of families, those with incomes in 20th to 40th percentiles. Highest wealth levels in 3 decades of records.
Net wealth⬆️22% over the last 2 years for lower middle-class families.
Net wealth⬆️22% over the last 2 years for lower middle-class families.

Average family wealth is at a record high for the next 20% of families, those with incomes in 40th to 60th percentiles. Highest wealth levels in 3 decades of records.
Net wealth ⬆️21% over the last 2 years for solidly middle-class families.
Net wealth ⬆️21% over the last 2 years for solidly middle-class families.

Average family wealth is at a record high for the next 20% of families, those with incomes in 60th to 80th percentiles. Highest wealth levels in 3 decades of records.
Net wealth⬆️31% over the last 2 years for upper middle-class families.
Net wealth⬆️31% over the last 2 years for upper middle-class families.

Average family wealth is at a record high for the next 19% of families, those with incomes in 80th to 99th percentiles. Highest wealth levels in 3 decades of records.
Net wealth⬆️18% over the last 2 years for high-income families.
Net wealth⬆️18% over the last 2 years for high-income families.

Average family wealth is at a record high for the top 1% of families. Highest wealth levels in 3 decades of records.
Net wealth⬆️37% over the last 2 years for the top 1% of families.
Net wealth⬆️37% over the last 2 years for the top 1% of families.

These financial measures would be better if I adjusted for inflation & population change but it wouldn't change the substantive short-run conclusions, & likely not long-run.
Prices are⬆️5.5% over the last 2 years throughout the economy (PCE deflator) &⬆️7.3% for consumers (CPI)
Prices are⬆️5.5% over the last 2 years throughout the economy (PCE deflator) &⬆️7.3% for consumers (CPI)
Black Americans' wealth is at a record high, up 32% in the last 2 years.

White Americans' wealth is at a record high,⬆️26% in the last 2 years.

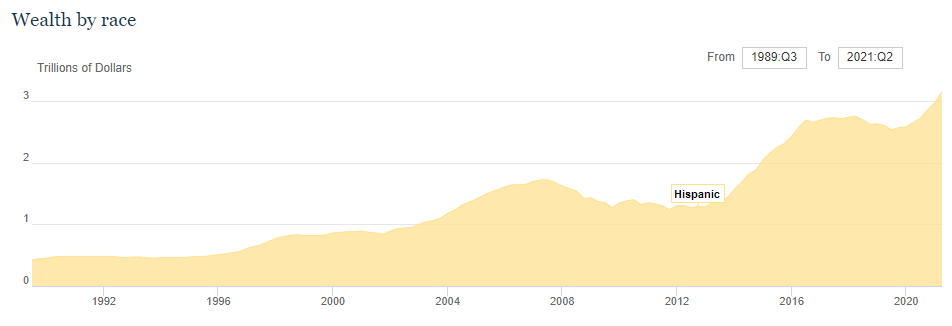
Hispanic Americans' wealth is at a record high, ⬆️21% in the last 2 years.
The wealth of Americans of other races and ethnicities is at a record high,⬆️27% in the last 2 years.

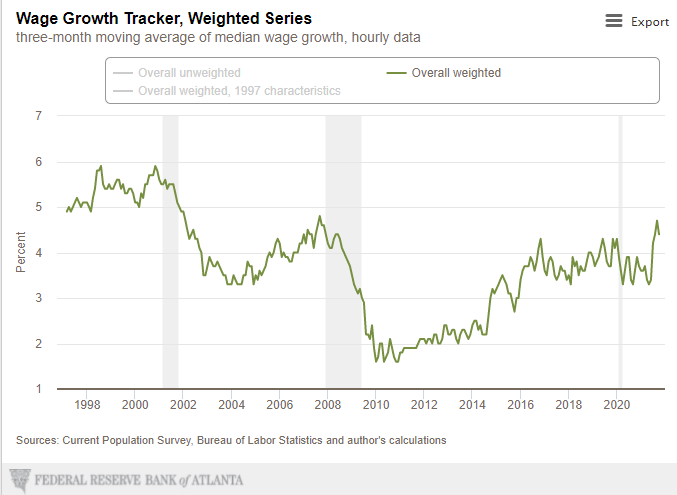
Median wage growth within worker was 4.4% last year and 3.6% the year prior.
It's a bit funky but one could think of this as 8.1% median wage growth over the last 2 years within-worker, controlling for compositional differences in who's working. Faster than price growth.
It's a bit funky but one could think of this as 8.1% median wage growth over the last 2 years within-worker, controlling for compositional differences in who's working. Faster than price growth.
Or look at real hourly labor compensation. This adjusts for inflation and hours worked and is ⬆️4.8% over the last 2 years.
Meanwhile, hourly labor productivity (output/hr) is ⬆️3.0%.
Meanwhile, hourly labor productivity (output/hr) is ⬆️3.0%.
Median wage growth within-worker for Zoomers has accelerated sharply in recent months & is accelerating for 25-34 year olds too, above the rate of price inflation.
For other workers, wage growth remains steady but slightly behind consumer price inflation.
For other workers, wage growth remains steady but slightly behind consumer price inflation.

What about government debt?
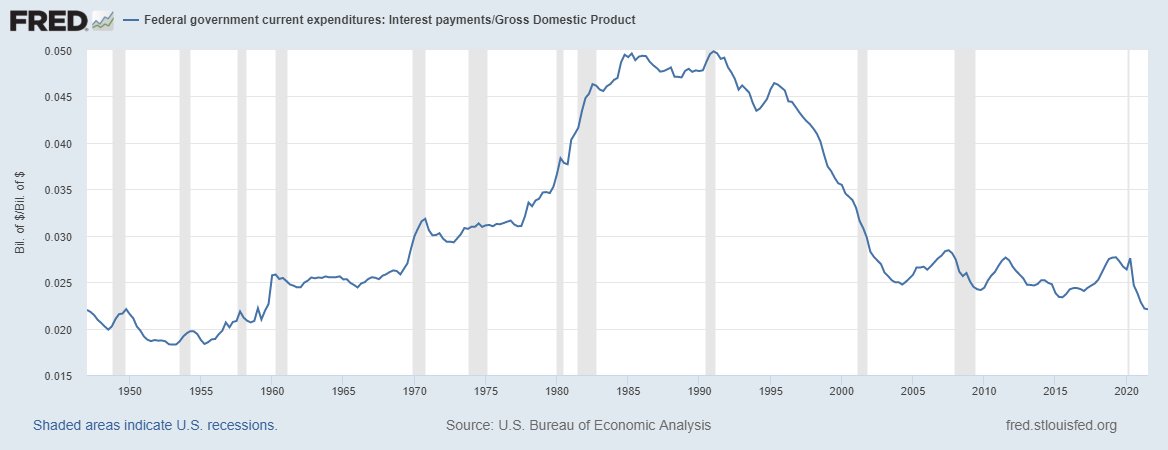
Interest payments as a share of GDP is lower than any time since 1959.
This will likely increase from here, but keep in mind where we are.
Interest payments as a share of GDP is lower than any time since 1959.
This will likely increase from here, but keep in mind where we are.
We have challenges in our economy, primarily the pandemic.
Also I worry about companies' exploiting their labor market power & consumer market power to under-employ, under-pay, under-produce, over-charge, & keep excess profits up.
Also I worry about companies' exploiting their labor market power & consumer market power to under-employ, under-pay, under-produce, over-charge, & keep excess profits up.
The big question: can supply increase in the real economy?
If no, need to cool demand & investment down.
If yes, we're well-positioned for growth. Better public health, infrastructure, care systems, competition, wages & working conditions will pull people from sidelines.
If no, need to cool demand & investment down.
If yes, we're well-positioned for growth. Better public health, infrastructure, care systems, competition, wages & working conditions will pull people from sidelines.
Millions of Americans will come back into employment if offered attractive enough opportunities.
+2.6 million prime-age Americans employed would get us back to their pre-pandemic employment rate & we can do better than 2019. We were still rising then.
More older Americans too.
+2.6 million prime-age Americans employed would get us back to their pre-pandemic employment rate & we can do better than 2019. We were still rising then.
More older Americans too.

It's the virus versus the rest of us. We still need to crush it at home & abroad before it steals more lives and livelihoods.
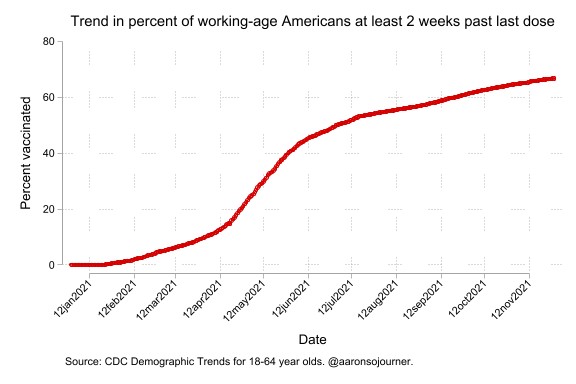
1 in 3 working-age Americans still not fully vaccinated.
Immunities from early vax & prior infection is waning. Get vax. Get booster. Mask up.
1 in 3 working-age Americans still not fully vaccinated.
Immunities from early vax & prior infection is waning. Get vax. Get booster. Mask up.
It's the virus versus the rest of us. Which side are you on?
https://twitter.com/jasonfurman/status/1460706318935678977?s=20
• • •
Missing some Tweet in this thread? You can try to
force a refresh