#BTC at important point right now in the 1hr chart!
It is very important right now for us to break above the 0.382fib which @TechDev_52 has shown beautifully in his chart!
For the moment, it does not look to bad. We might be getting that breakout pretty soon!
It is very important right now for us to break above the 0.382fib which @TechDev_52 has shown beautifully in his chart!
For the moment, it does not look to bad. We might be getting that breakout pretty soon!
https://twitter.com/TechDev_52/status/1462421198407622657

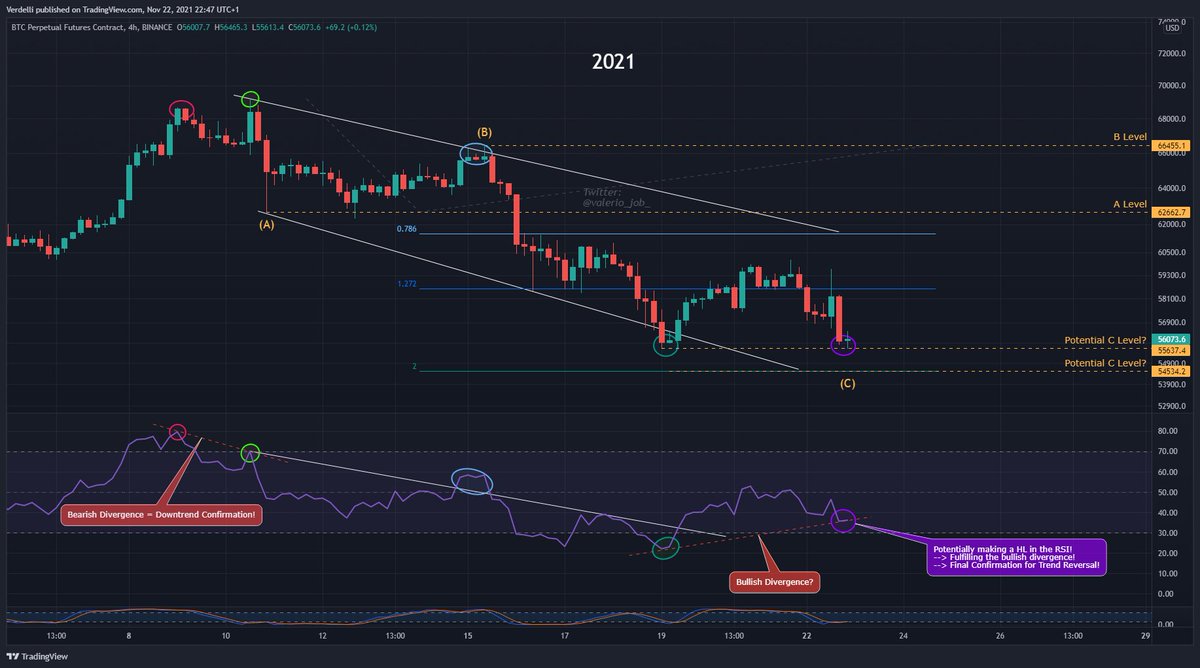
The .382fib lvl is a very important area. It has been used as support from Nov 16th to Nov 18th. From Nov 19th on we have been forming and holding this ascending channel very well. We touched the .382fib as resistance already yesterday + earlier today and are nearing it again rn!

Now, what happens next?
Well so far we have seen the golden cross where the 21 EMA crossed above the 55 EMA which is definitely a positive sign that supports a bullish breakout! Also we can clearly see how well the 55 EMA was holding as support during the past 24 hrs.
Well so far we have seen the golden cross where the 21 EMA crossed above the 55 EMA which is definitely a positive sign that supports a bullish breakout! Also we can clearly see how well the 55 EMA was holding as support during the past 24 hrs.

Now what I'm looking for in the very near future are three things:
1) RSI: Bouncing off the trendline in the RSI!
2) PA: A clean breakout above the trendline + the red resistance area!
3) PA: Flipping the .382fib!
1) RSI: Bouncing off the trendline in the RSI!
2) PA: A clean breakout above the trendline + the red resistance area!
3) PA: Flipping the .382fib!

With that being said, if we fall out of this ascending channel and if we fall below the trendline in the RSI, this theory gets invalidated and we will most likely see us retesting some of the lower lvls again. And once we have more momentum we will come back and smash through!

We might get a nice Monday surprise:)
Wishing everyone an amazing start into this next week! Will for sure be a great week!🔥
Let's go Champs!👊💯
Wishing everyone an amazing start into this next week! Will for sure be a great week!🔥
Let's go Champs!👊💯
*Also shoutout to @TechDev_52 on finding the importance of us breaking above the .382fib!🤝
Oh and btw only because I drew a ‚straight’ line to 64.5k & 67k doesnt mean that we will reach these target without any resistances! Like not at all! I just wanted to share a potential breakout target „IF“ we were to break above this ascending triangle!
• • •
Missing some Tweet in this thread? You can try to
force a refresh