That is the pullback I was expecting for #Bitcoin !
Playing out well so far! Finally we can start seeing the bullish divergence I was waiting for in the 4hr Chart!🔥
Bullish!🙌
Who is bullish with me?🤝
Playing out well so far! Finally we can start seeing the bullish divergence I was waiting for in the 4hr Chart!🔥
Bullish!🙌
Who is bullish with me?🤝
https://twitter.com/valerio_job_/status/1461844381380624390

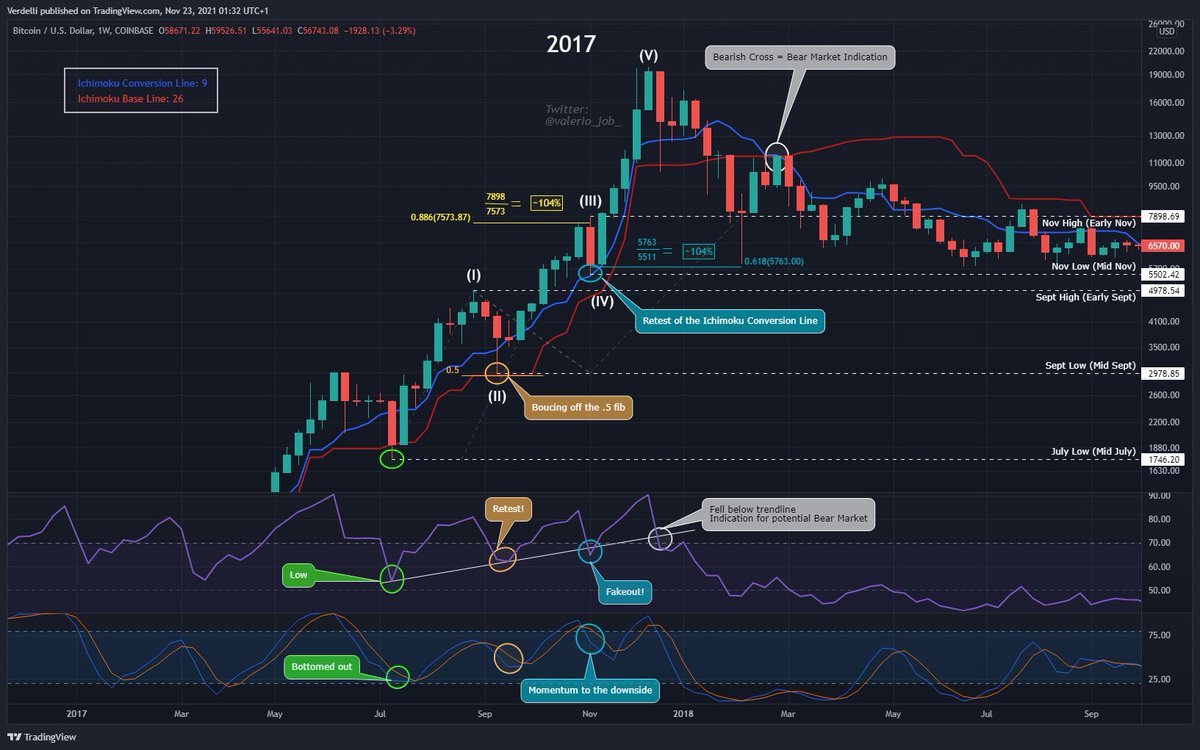
Deleted a lot of details and explanations in the chart as it was way too much information. Feel free to go back to my older thread if you haven't read it yet or want to see the chart explanations again.
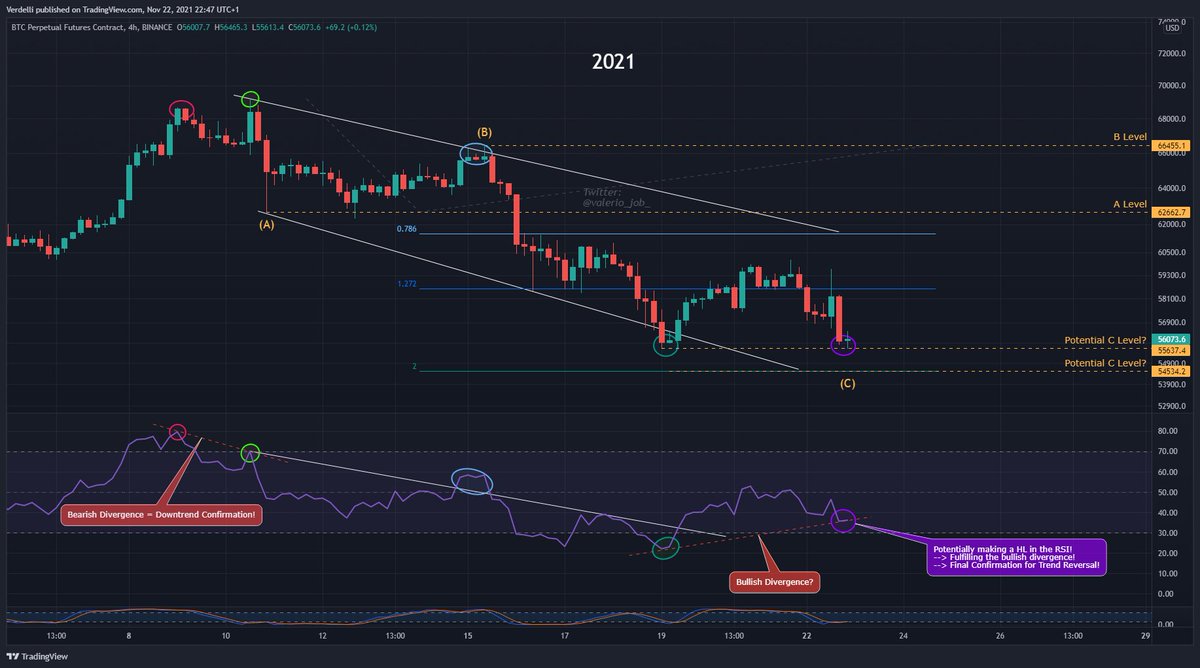
As I already said in the prev tweet, price dropping is/was important to fulfill the bullish divergence. We just saw another Low in the PA and a higher Low in the RSI. That is very very key!

The only question is whether we hold this $55.6k lvl or not and whether we hold the current RSI lvl + bounce off the red trendline. Even if we drop a little more the idea can still be valid. We only need to make sure we make a HL in the RSI which fulfills the bullish div again!

Are you bullish🐂 or bearish🐻 right now?⬇️
• • •
Missing some Tweet in this thread? You can try to
force a refresh