Get a simple overview of 50+ #Bitcoin #onchain analytics by zooming out.
🤗#BTC changed my life. I'm sharing these to help others leverage the edge of onchain analytics.
👉Follow me @BinkiePondarosa for a weekly cycle summary
🙏Please Retweet to help others!
A thread🧵1/5


🤗#BTC changed my life. I'm sharing these to help others leverage the edge of onchain analytics.
👉Follow me @BinkiePondarosa for a weekly cycle summary
🙏Please Retweet to help others!
A thread🧵1/5


MARKET TOPS - reveal themselves in the data:
-->🟥 Most indicators turn RED
-->🎯BTC price > top price predictions
-->🪙Cycle Valuation % is > 100%
How the last cycle peak looked:
2/5
-->🟥 Most indicators turn RED
-->🎯BTC price > top price predictions
-->🪙Cycle Valuation % is > 100%
How the last cycle peak looked:
2/5

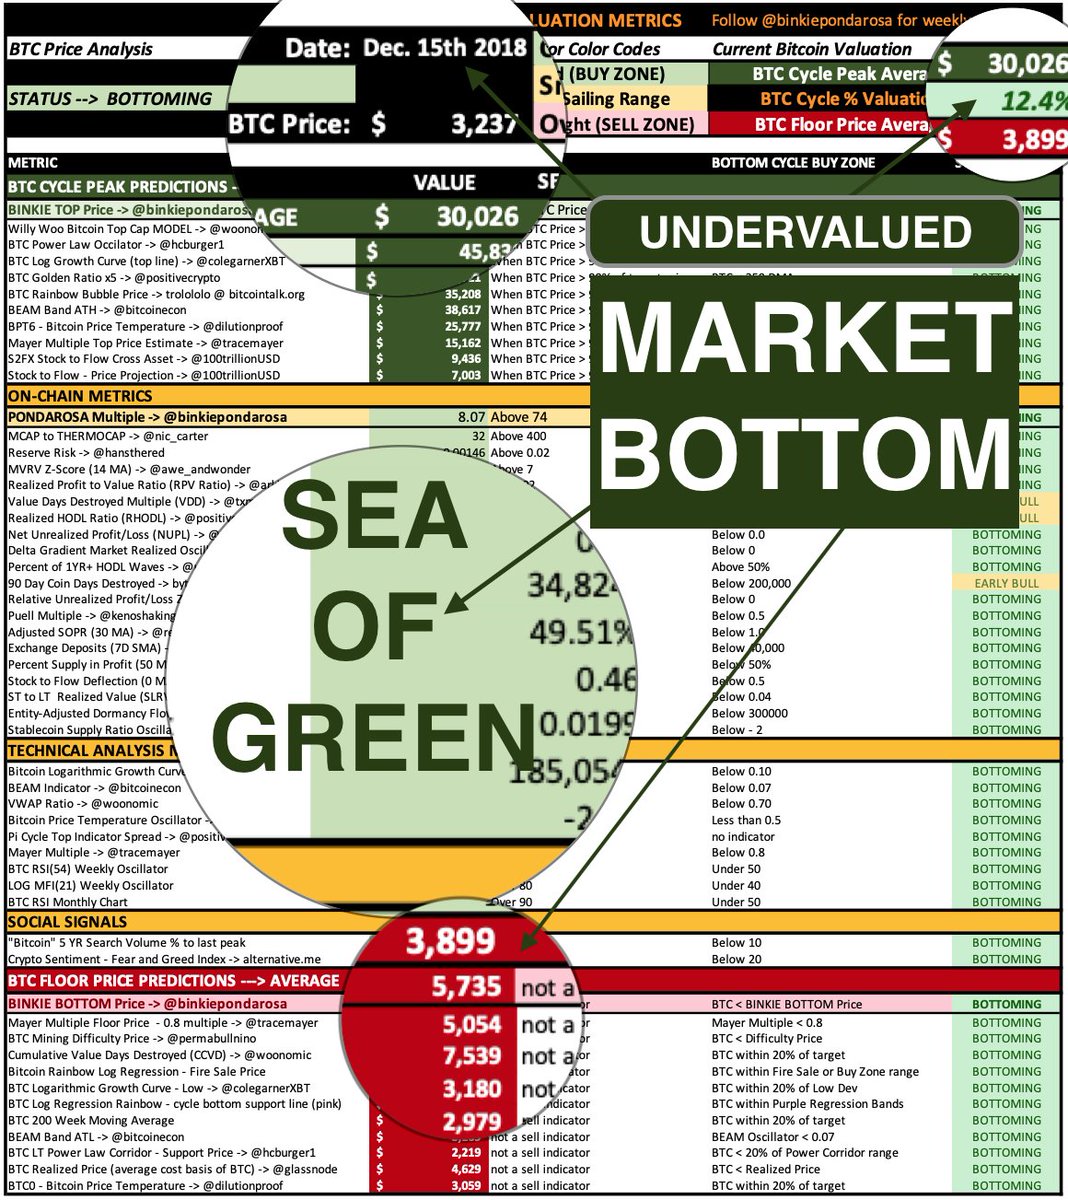
MARKET BOTTOMS - reveal themselves in the data:
-->🟩 Most indicators turn GREEN
-->🎯BTC price < price floor predictions
-->🪙Cycle Valuation % is < 30%
How the last cycle bottom looked:
3/5
-->🟩 Most indicators turn GREEN
-->🎯BTC price < price floor predictions
-->🪙Cycle Valuation % is < 30%
How the last cycle bottom looked:
3/5

MID CYCLES - also reveal themselves in the data:
-->🟨 Most indicators turn YELLOW
-->🎯BTC price between peak & floor predictions
-->🪙Cycle Valuation % is between 30-90%
How a mid cycle run looks:
4/5
-->🟨 Most indicators turn YELLOW
-->🎯BTC price between peak & floor predictions
-->🪙Cycle Valuation % is between 30-90%
How a mid cycle run looks:
4/5

Onchain data and analytics is the one edge we have over traditional market analysis.
🪙Let's use it to our advantage and fix the world in the process. Buy Bitcoin.
🙏Please Retweet so others don't get REKT.
5/5
🪙Let's use it to our advantage and fix the world in the process. Buy Bitcoin.
🙏Please Retweet so others don't get REKT.
5/5

• • •
Missing some Tweet in this thread? You can try to
force a refresh


