Between 2010 and 2019, total UK spending on education fell by £10bn (8%) in real terms.
This includes a 9% real-terms fall in school spending per pupil and a 14% fall in spending per student in colleges.
These cuts are without precedent in post-war UK history.
[THREAD: 1/7]
This includes a 9% real-terms fall in school spending per pupil and a 14% fall in spending per student in colleges.
These cuts are without precedent in post-war UK history.
[THREAD: 1/7]
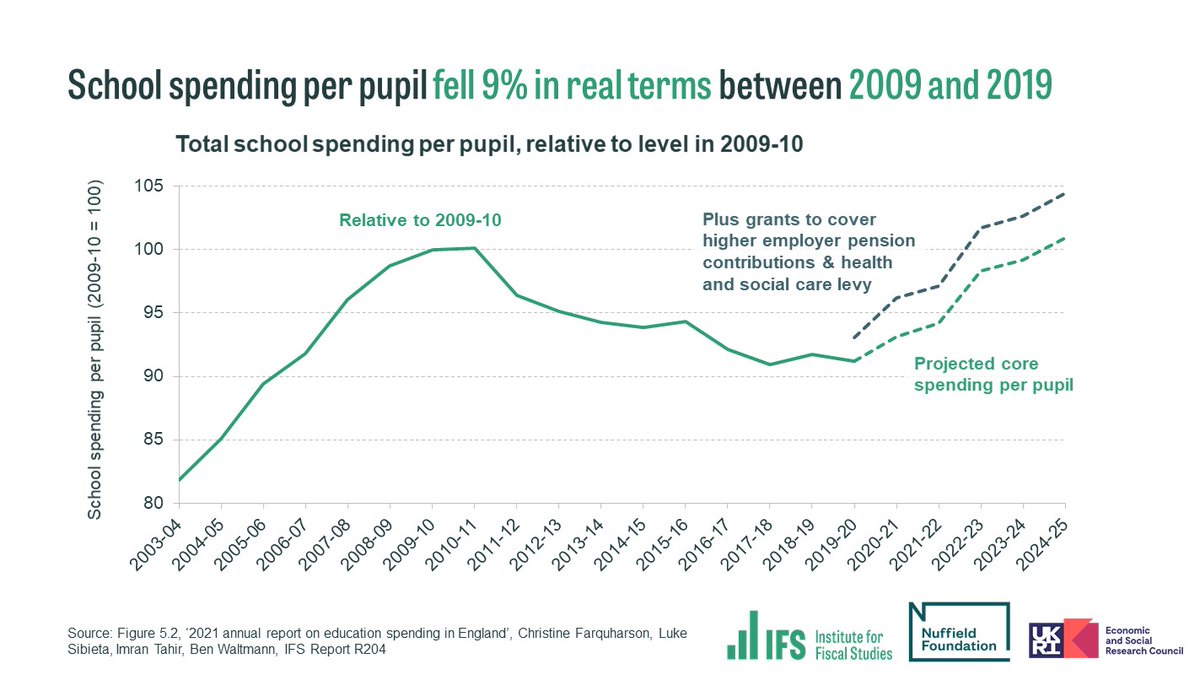
The £4.4 billion for the schools budget in 2024 announced in the Spending Review will bring spending per pupil back to 2010 levels and reverse past cuts.
But this means there will have been 15 years with no overall growth in school spending.
[2/7]
But this means there will have been 15 years with no overall growth in school spending.
[2/7]
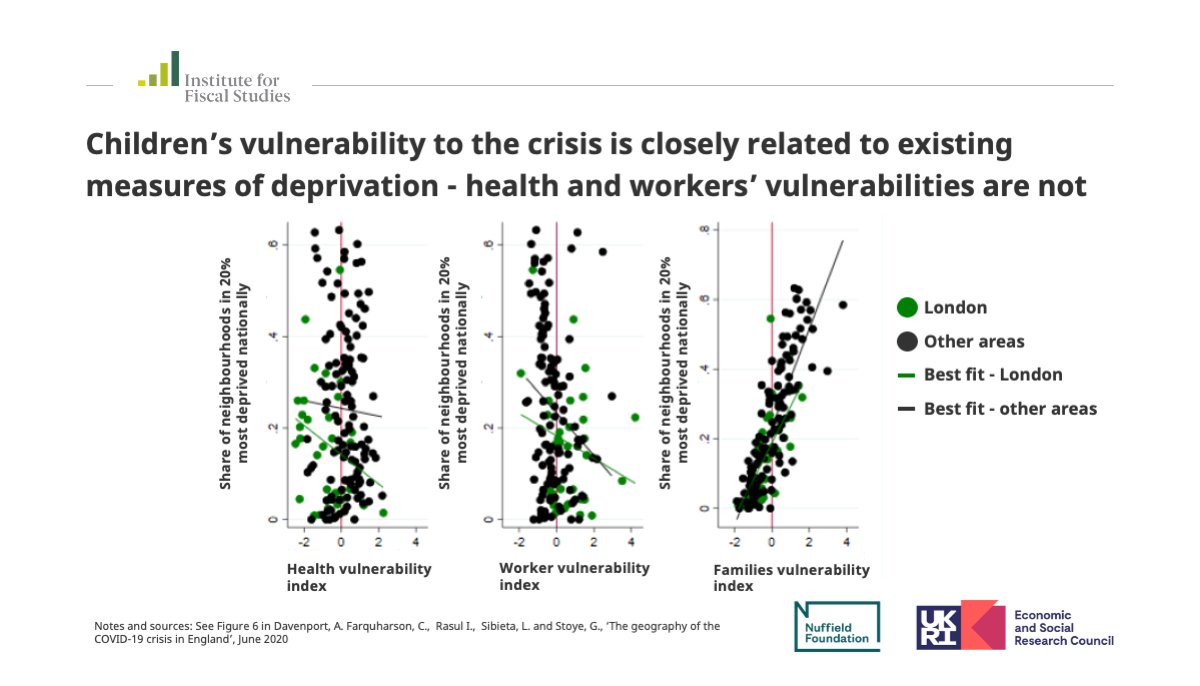
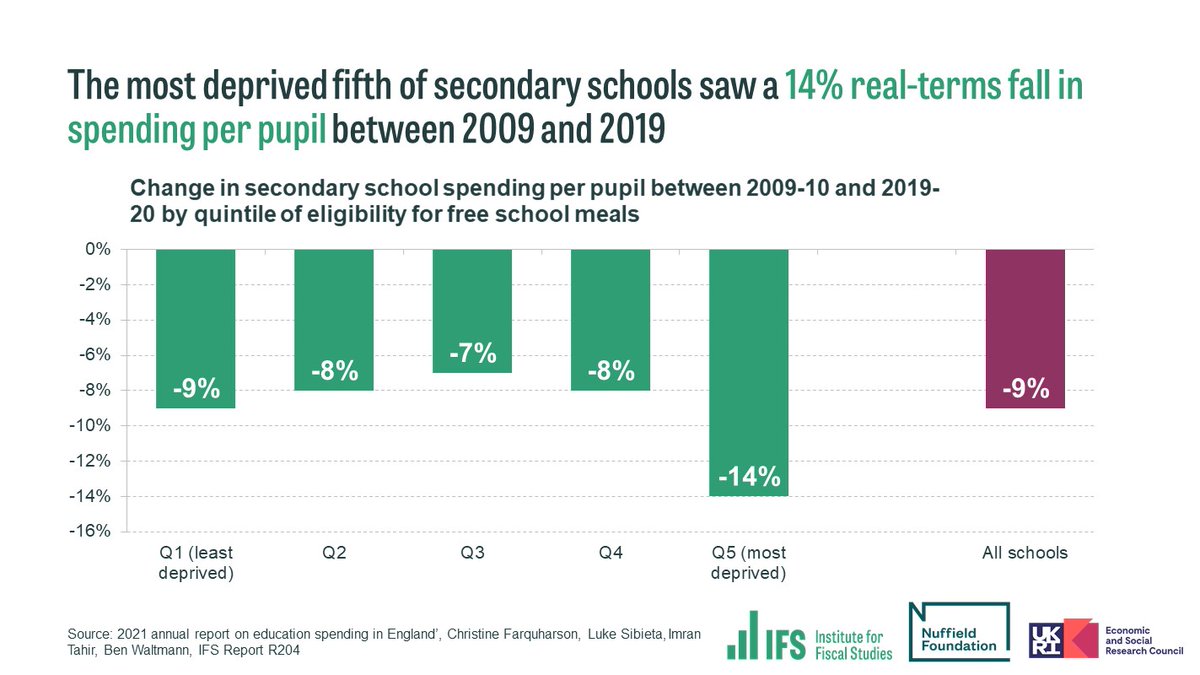
Deprived schools have seen larger cuts over the last decade.
The most deprived fifth of secondary schools saw a 14% real-terms fall in spending per pupil between 2009 and 2019, compared with a 9% drop for the least deprived schools.
[3/7]
The most deprived fifth of secondary schools saw a 14% real-terms fall in spending per pupil between 2009 and 2019, compared with a 9% drop for the least deprived schools.
[3/7]
The National Funding Formula has given bigger real-terms increases for the least deprived schools (8–9%) than for the most deprived ones (5%) between 2017-2022. The Pupil Premium hasn't kept pace with inflation since 2015.
This has negative implications for levelling up.
[4/7]
This has negative implications for levelling up.
[4/7]

Even with additional funding from the recent Spending Review, college spending per pupil in 2024 will still be around 10% below 2010 levels, while school sixth-form spending per pupil will be 23% below 2010 levels.
[5/7]
[5/7]

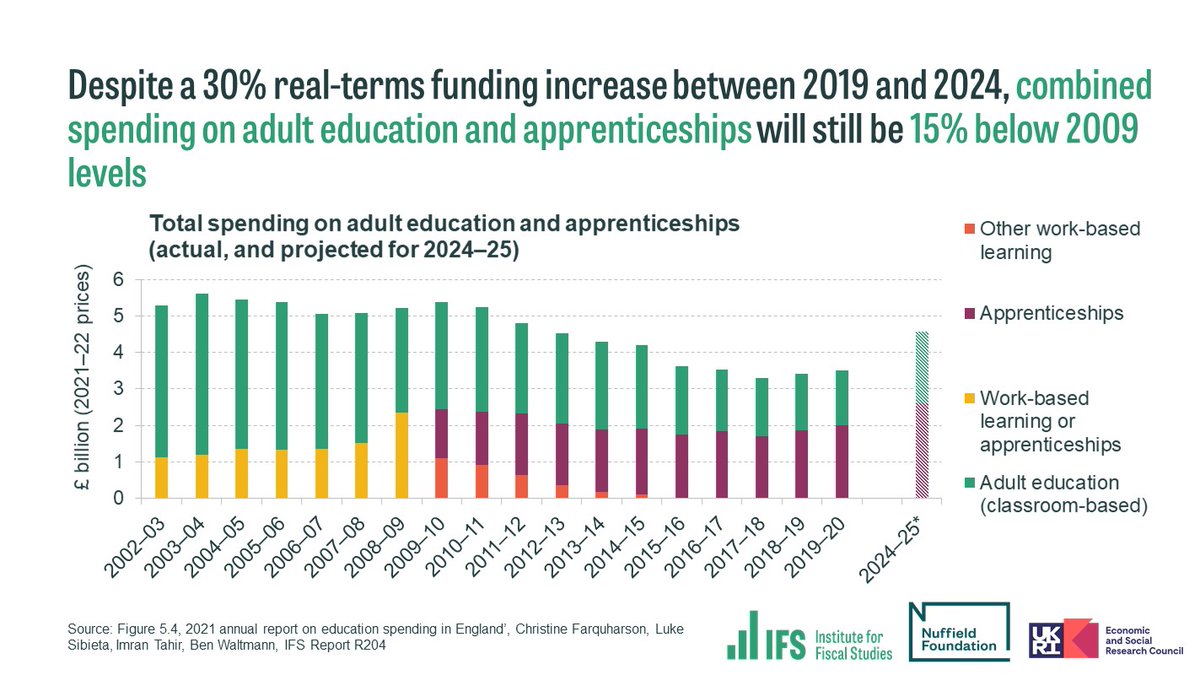
And although additional Spending Review funding means adult education & apprenticeships funding will rise by 30% in real terms between 2019-24, spending will still be 15% below 2009 levels.
Spending on adult education on its own fell by 49% between 2009 and 2019.
[6/7]
Spending on adult education on its own fell by 49% between 2009 and 2019.
[6/7]
‘This will make it that much harder to achieve ambitious goals to level up poorer areas of the country and narrow educational inequalities, which were gaping even before the pandemic,’ warns @lukesibieta.
Read the full report here > ifs.org.uk/publications/1…
[7/7]
Read the full report here > ifs.org.uk/publications/1…
[7/7]
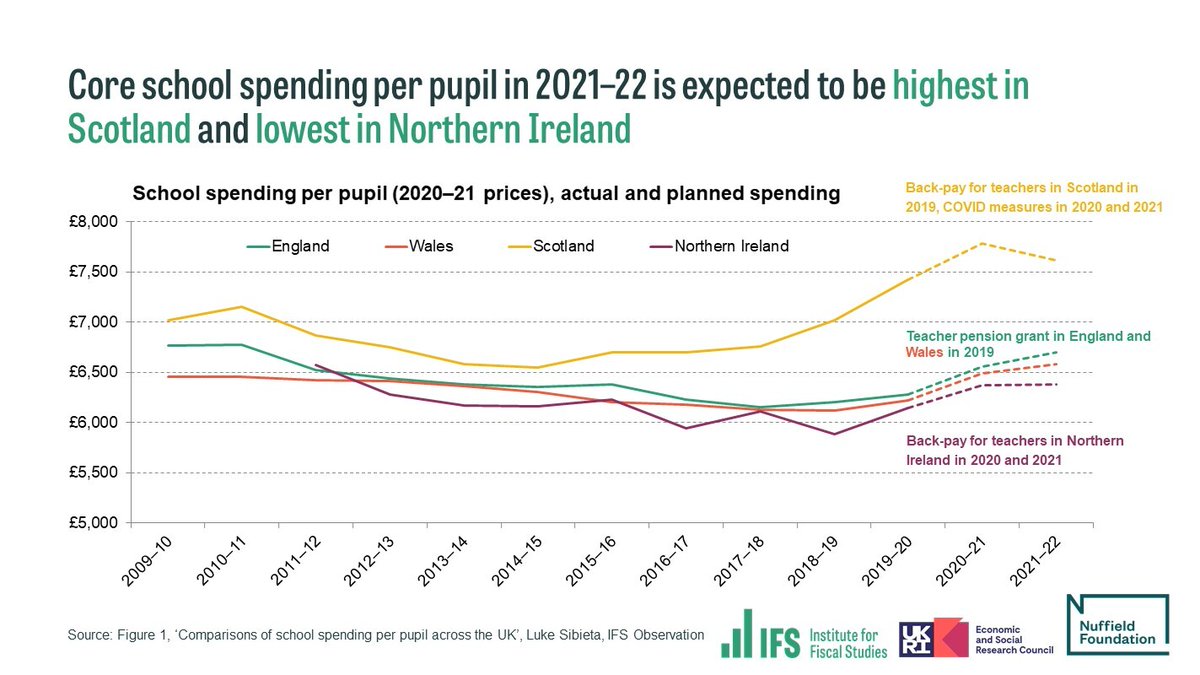
Tweets 2-7 refer to England's education spending, you can read our report looking at spending in Scotland, Wales and Northern Ireland here > ifs.org.uk/publications/1…
• • •
Missing some Tweet in this thread? You can try to
force a refresh