We are building a new congressional data archive with member, district, & policymaking variables by district-year & state-year, modeled on @IPPSR’s Correlates of State Policy:
ippsr.msu.edu/public-policy/…

& @joshmccrain’s congressional data integrations:
congressdata.joshuamccrain.com/congressional_…
We are currently cataloging available data, making crosswalks, converting/aggregating bill & policymaking data to district-year, updating, & compiling all district Census data. If you have relevant datasets, suggestions, or problem notes, please reach out. We would love your help
Our goal is to make an easy-to-use interface for working with available subsets of data, such as a project on environmental or health congressional voting with relevant member & district characteristics, similar to our Shiny app for state policy:
cspp.ippsr.msu.edu/cspp/
We expect to release a baseline congressional data product this Spring but want to connect now with anyone doing or planning similar aggregation. We welcome data going back far in time & data that can be linked to other congressional or policy datasets through member or district

• • •

Missing some Tweet in this thread? You can try to force a refresh
 

Keep Current with Matt Grossmann

Matt Grossmann Profile picture

Stay in touch and get notified when new unrolls are available from this author!

Read all threads

This Thread may be Removed Anytime!

PDF

Twitter may remove this content at anytime! Save it as PDF for later use!

Try unrolling a thread yourself!

how to unroll video
  1. Follow @ThreadReaderApp to mention us!

  2. From a Twitter thread mention us with a keyword "unroll"
@threadreaderapp unroll

Practice here first or read more on our help page!

More from @MattGrossmann

2 Dec
I loved “Dawn of Everything”

Here’s the best review I’ve found:
washingtonpost.com/outlook/after-…

You do have to see it as a political project combined with an early human history & popularization of anthropology, but it shows how we can learn by questioning biases of received history
In How Social Science Got Better, I found that popularized debates make progress by bringing scholars with very different knowledge bases & assumptions into conversation. There is lots of overclaiming but it can clarify disputes. We also learn by thinking from different biases
They mostly find a lot more variation than we usually hear, across types of social organization, bases of governance, priorities, scales, & seasonality, with no global developmental sequence. Despite lots of speculation, it is mostly about how we don’t know as much as we assume
Read 4 tweets
9 Nov
Good video on how many all-Dem states & cities have restrictive housing, regressive taxes, & segregated education.

But state policy changes very slowly, only partly due to partisanship, & most policies have limited effects:
mattgrossmann.tumblr.com/redstateblues
Overall, Democratic & Republican states don't perform differently across objective indicators, even though you can find polarized policies with real effects:
niskanencenter.org/do-democrats-a…

We consistently overestimate the party control -> policy change -> socio-economic outcomes path
On these 3 issues:
Housing: Dem states are more restrictive, though mostly due to local policies
Taxes: Overall, Dem states are more progressive, despite the outliers here
Education: Limited spending & equalization effects of party control, not enough to matter for outcomes
Read 4 tweets
5 Nov
This confusion seems to be widespread. Thermostatic politics does not require Biden to change his policy proposals from the campaign. It also does not require close voter attention to policy detail. It just requires voters to see or expect a leftward change in policy from Trump
eg voters asked in the Trump era whether they want more or less immigration or more or less health care spending are now being asked more or less from a new (or expected new) status quo. Fewer should now say more & more should say less, even if no one has changed ideal views
How much that (widespread & largely mechanical) pattern causes changes in votes or differential turnout is a more controversial ? But no one should think “he said it in the campaign” “they haven’t passed all of it yet” or “voters don’t know the details” undermines the pattern
Read 4 tweets
18 Oct
New @ippsr report on Michigan redistricting draft maps for hearings this week:
ippsr.msu.edu/sites/default/…

We analyzed the collaborative maps across their criteria

Some initial findings:
ippsr.msu.edu/sites/default/…

More resources:
ippsr.msu.edu/redistricting
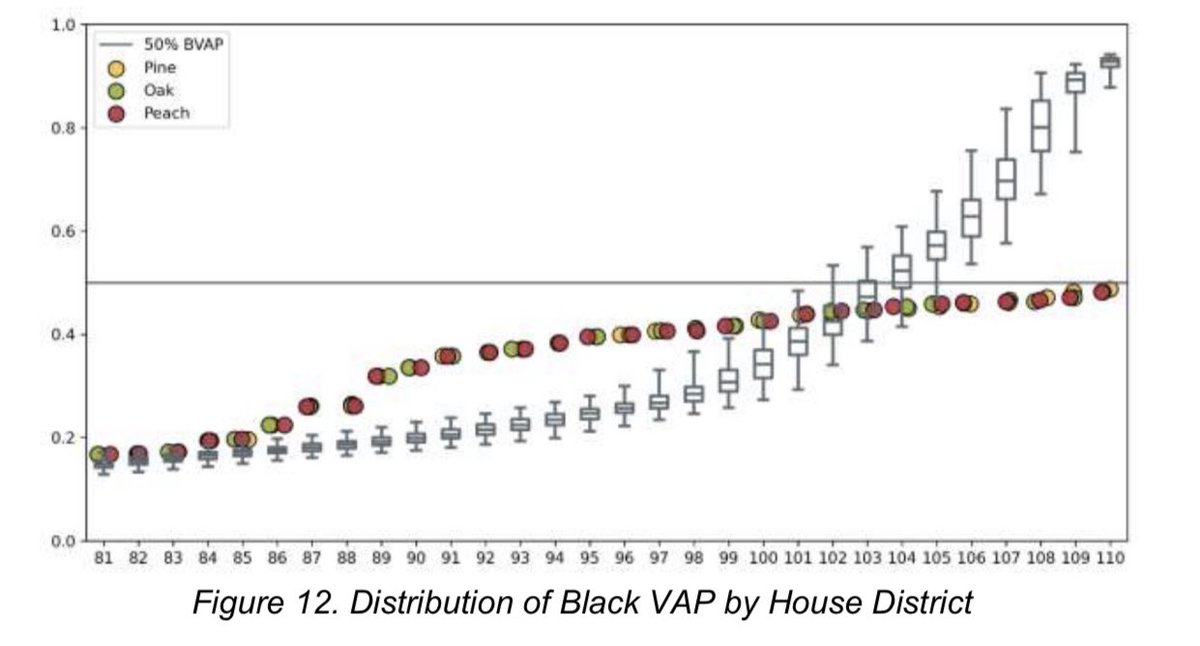
The Commission pursued a voting rights strategy that maximizes districts with Black population around 40%. Compared to the computer-generated random maps, this looks quite different. Here are draft maps for state House with the highest Black populations:

ippsr.msu.edu/sites/default/…
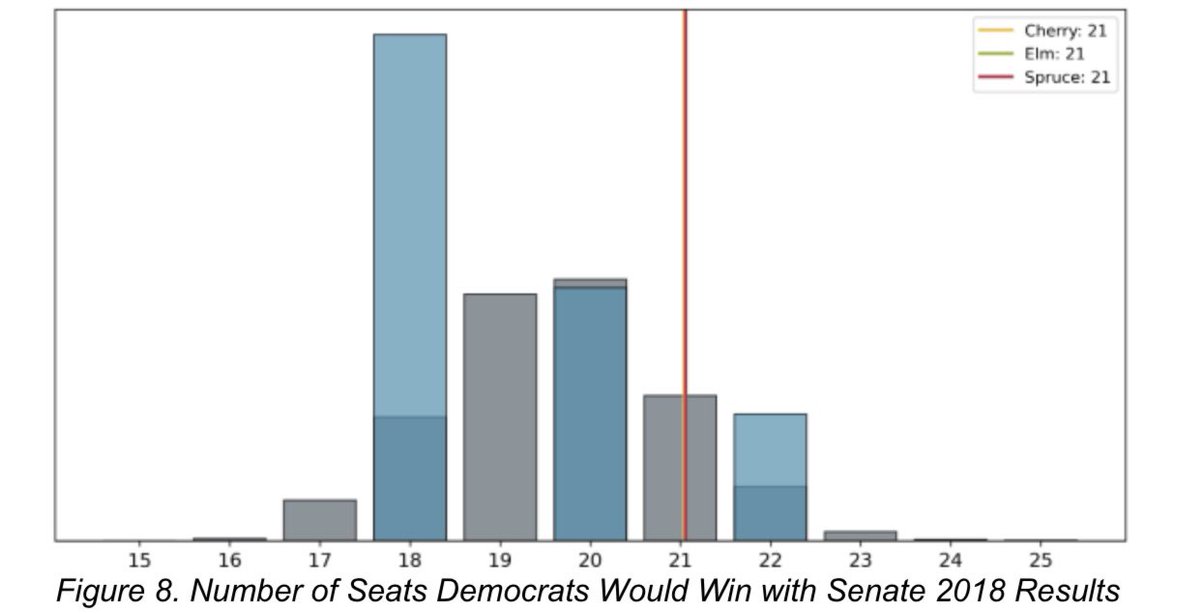
On partisan fairness, the maps are between perfect symmetry & what would be expected from randomly-drawn maps (which would favor Reps). For example, here is seat share for 38 member senate based on the 2018 Senate results compared to computer & public maps
ippsr.msu.edu/sites/default/…
Read 6 tweets
12 Oct
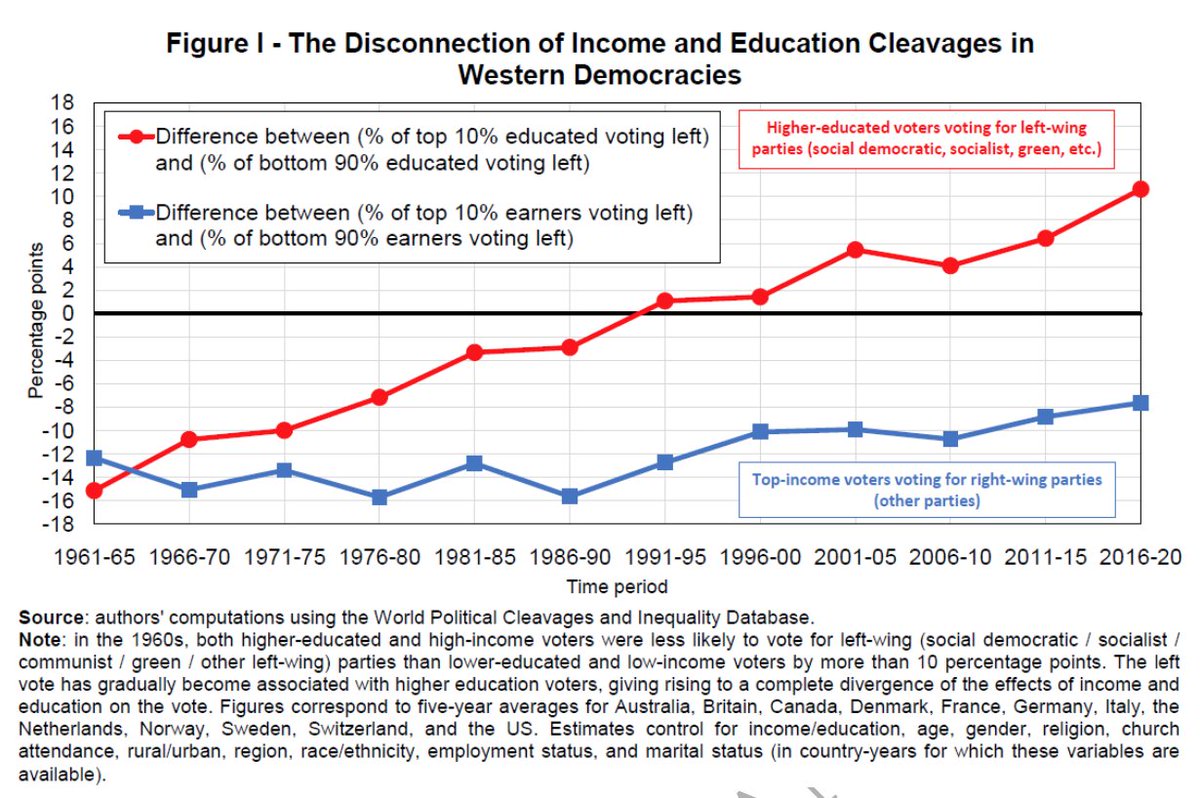
Across Western democracies, the education divide slowly reversed from higher education voters favoring parties on the ideological right in the 1960s to favoring parties on the ideological left by 2020, easing but not reversing the income divide
academic.oup.com/qje/advance-ar…
In multi-party systems, the education divide coincided with the rise of Green parties on high-education left & anti-immigration parties on low-education right. In the US, factions arose within the major parties, making the 2-party education divide stronger & income divide weaker
Globally, party vote share among the highest educated has become more correlated with party platform positions on sociocultural issues. Party vote share among the highest income voters remains correlated with its party platform positions on economic issues
watermark.silverchair.com/qjab036.pdf?to…
Read 4 tweets
12 Oct
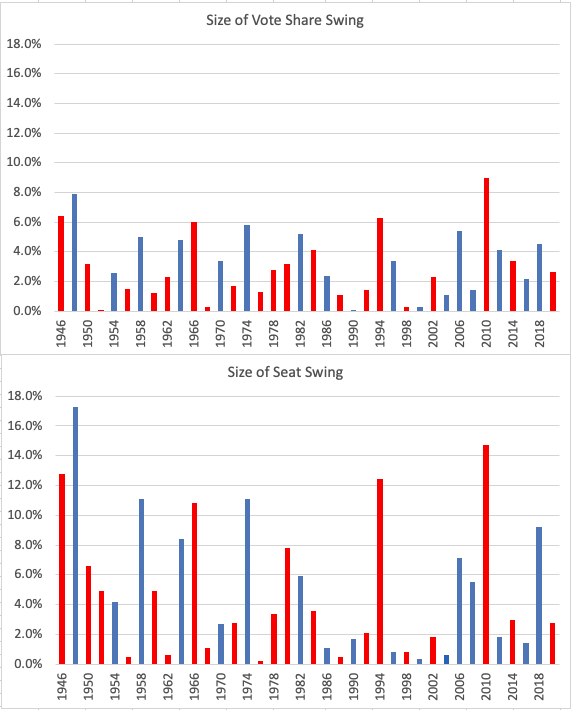
The average swing against the president's party in the midterm election is -3.8% in share of the national House popular vote & -6.2% in House seat share. If that happened from 2020 to 2022, Dems would end up with only 47.7% of the 2-party popular vote & a 45 seat deficit Image
So far, Biden’s underwater approval has not translated into any sign of an anti-Democratic wave on the generic ballot. But research finds ballot numbers follow prez approval & a thermostatic ideological reaction against direction of policy. An R wave would be historically normal ImageImage
We’re having a 2024-appropriate election discussion when the electoral task at hand for Democrats is avoiding a massive wave against them in 2022. 1994 & 2010 were huge & impactful National & state-level waves. They were products of large public thermostatic swings, not messaging
Read 4 tweets

Did Thread Reader help you today?

Support us! We are indie developers!


This site is made by just two indie developers on a laptop doing marketing, support and development! Read more about the story.

Become a Premium Member ($3/month or $30/year) and get exclusive features!

Become Premium

Too expensive? Make a small donation by buying us coffee ($5) or help with server cost ($10)

Donate via Paypal

Thank you for your support!

Follow Us on Twitter!

:(