1. In the IFES webinar on Monday I projected 96 million planted acres for corn in 2022 for the US. A number of people have asked how in the world I get to such a high number. The key is not found in corn acreage but total planted acreage for all crops. Let me explain.
2. History of US total planted crop acreage starting in 2006. Start of the ethanol boom. Total acreage = principal crop acreage + prevented plant acreage. This is what US farmers planted or intended to plant for 22 crops. Big 3 of corn/soy/wheat about 70%. Image
3. I like to add actual PC + PP to get total intended planted crop acreage each year. This is the topline number we want to focus on as the starting point for 2022. Note that total dropped almost 13 million acres from 2013-2021. Image
4. 2021 total of 319.3 was a surprise to many analysts, including myself. I thought we would at least recover back to the 2019 level. Think the problem was not enough appreciation of lags involved in bringing acres back into crop production. Image
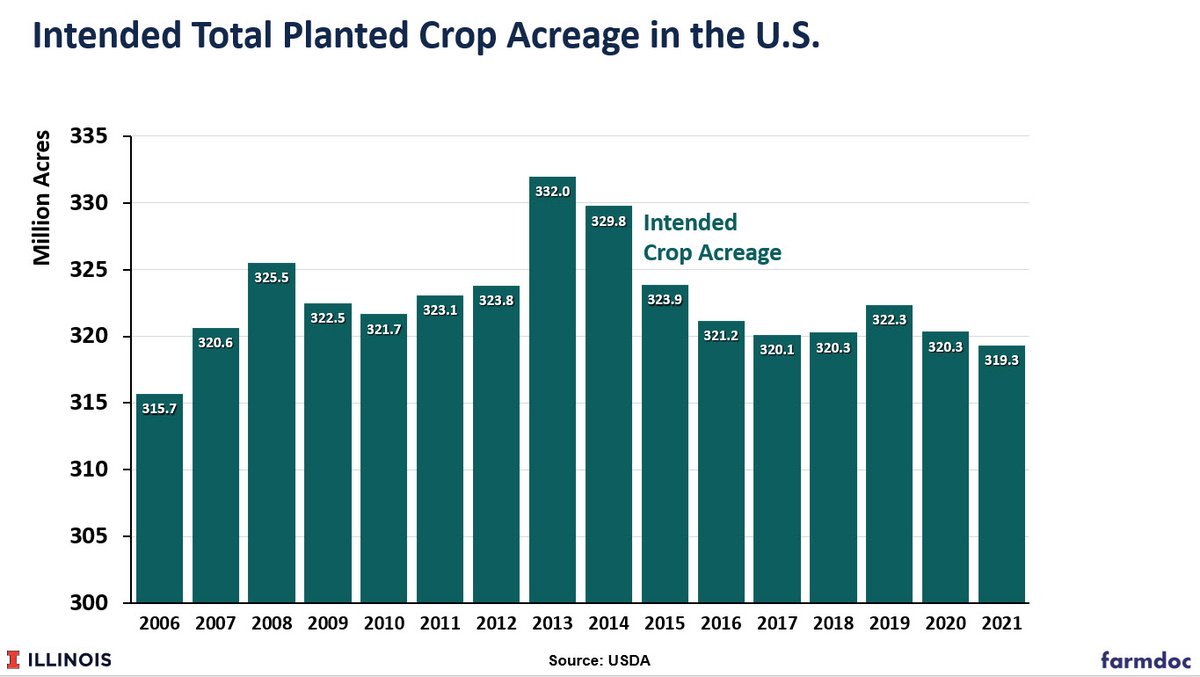
5. So now lets look at acreage response to economic incentives. Here I plot total intended acreage vs. price of corn in the previous marketing year. Certainly not a perfect fit but clearly total expanded as corn price increased and then reversed as price fell. Image
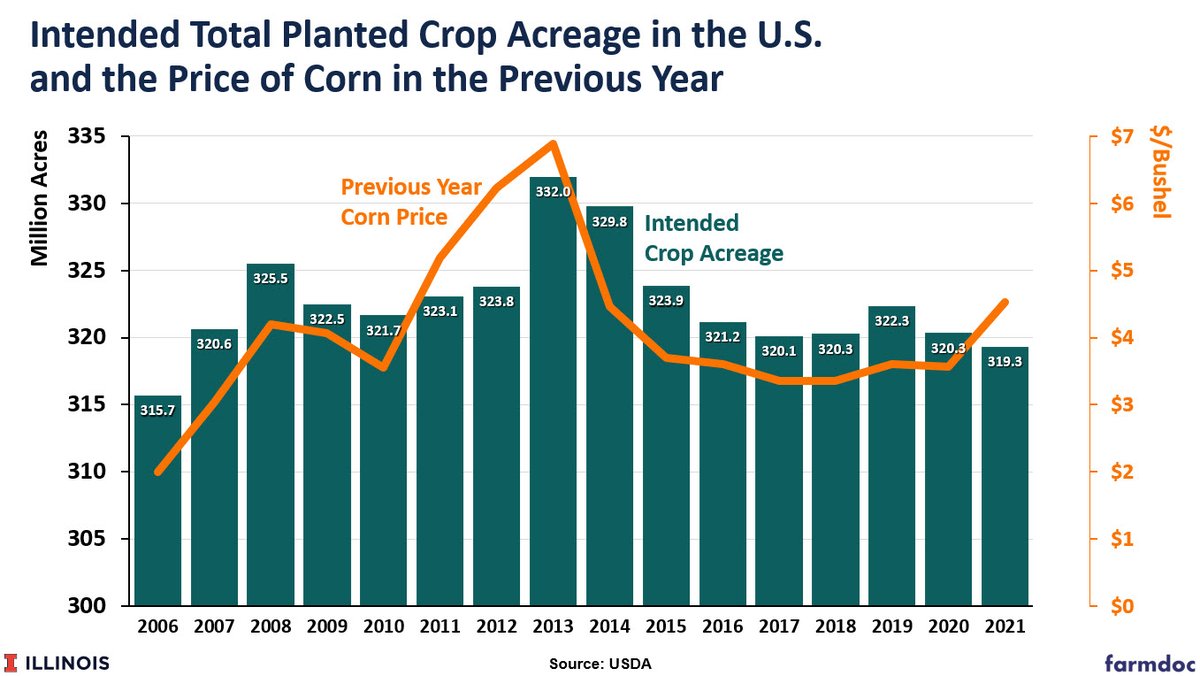
6. Plotted this way you can see why many analysts thought total acreage would expand in 2021. But the lags are more than one year and complicated. Look at 2011 and 2012 vs. 2013. Image
7. Now turn to 2022. The price for 2022 is $5.45, Nov WASDE estimate for 2021/22 marketing year. Matching that price increase is my projection of an increase of 7.2 million acres in total crop acreage in 2022. While a big jump, it still does not get back to 2013/14 peak. Image
8. This is a key assumption underlying my corn/soybean acreage projections for 2022. Expansion of total allows room for all profitable crops to expand planted acreage, particularly for corn, wheat, and cotton. Image
9. If I am wrong about total acreage, which can certainly happen, then I don't see how we can get to 96 million on corn. Finally, note this is a very simple analysis. For one, only using corn price as the indicator of overall crop profitability. Image

• • •

Missing some Tweet in this thread? You can try to force a refresh
 

Keep Current with Scott Irwin

Scott Irwin Profile picture

Stay in touch and get notified when new unrolls are available from this author!

Read all threads

This Thread may be Removed Anytime!

PDF

Twitter may remove this content at anytime! Save it as PDF for later use!

Try unrolling a thread yourself!

how to unroll video
  1. Follow @ThreadReaderApp to mention us!

  2. From a Twitter thread mention us with a keyword "unroll"
@threadreaderapp unroll

Practice here first or read more on our help page!

More from @ScottIrwinUI

3 Dec
1. Weekend Reading: Continuing theme of market impact of USDA crop and livestock reports. Next up is a 2008 JAAE paper with co-authors on "The Impact of Situation and Outlook Information in Corn and Soybean Futures Markets: Evidence from WASDE Reports." ageconsearch.umn.edu/record/45048?l…
2. Focus on this paper for two reasons. #1 My first use of price volatility tests vs. market surprise tests of market impact of USDA reports. #2 My belief that every good empirical paper has to have a money chart.
3. Price volatility tests of market reaction are now a workhorse of event studies. Basically, measure price volatility on report release days vs. non-report release days. If USDA reports contain valuable information then prices should move.
Read 9 tweets
2 Dec
1. Could not resist one more data exercise on corn and soybean planted acreage for 2022. Gonna reverse engineer things here. Asking how likely is 91 million planted acres for corn given current market incentives? Image
2. What I do is drop total planted corn/soy acreage back to 181.5 million and then assume corn planted acreage will be 91 million. Certainly some in the market thinking this way. Gives 91 mil for corn and 89 mil for soybeans. Implies a split of 49.3% for soybeans. Image
3. Now I simply plot current 22 new crop soybean/corn price ratio of about 2.25 vs. 49.3% planted acreage for soybeans. We would be looking at uncharted territory at least in recent history if that were to happen. Certainly not impossible but unlikely. Image
Read 6 tweets
2 Dec
1. Yesterday I had a thread on my projection of total planted crop area in the US for 2022. Crucial part of my projection for corn and soybean planted acreage. Oh. I need to also apologize for missing my interview with @MikeAdamsAg. Got my booster and it did not go well :(
@MikeAdamsAg 2. To recap, I projected total planted acreage in 2022 to rebound to 326.5 million acres based on the lagged impact of high grain prices. This would allow all major crops to expand acreage at least somewhat, e.g., corn would not have to steal acres from wheat. Image
@MikeAdamsAg 3. With that background I can walk through how I go to 96 million for corn. I start by projecting the total combined corn/soybean planted acreage. Pretty steady in recent years around 181-182 million. I jump it to 183 million based on high prices. Note only +1.5 mil over 2021. Image
Read 10 tweets
19 Nov
1. Weekend Reading: Continuing with my research on USDA reports. Up today is my 1994 JEBO article with Phil Garcia, Ray Leuthold, and Li Yang. So many interesting back stories on this article. sciencedirect.com/science/articl… (pretty sure behind Elsevier pay wall)
2. Paper had its beginnings in an early 90s working paper by Phil and Ray. Ray had a former student who worked at Sparks Commodities, which became Informa, which became IHS Markit. This person gave Ray the history of Sparks and Conrad Leslie corn/soy production forecasts.
3. Conrad Leslie was a real pioneer in this regard. Started in the 60s doing a famous "postcard" survey of yield expectations from elevator managers and others (e.g., Darrel Good) before USDA crop reports. I was fortunate enough to talk to him a few times. A real character.
Read 12 tweets
18 Nov
1. First domino to fall on the 2020 and 2021 RFS RVOs. Yesterday, EPA proposed extending deadlines for 2019 SR compliance and 2020 & 2021 compliance for all obligated parties based on publication of 2020 & 2021 RVOs in Federal Register. Got that? See text below for details.
2. First off, I have no idea if this "sliding" approach to RFS compliance is legal or not. If nothing else, a long, long way from the original policy of compliance occurring shortly after the calendar year ends.
3. In addition, I don't know what this implies for the really important outstanding questions about RFS compliance and RVOs that are forthcoming someday from the Biden EPA.
Read 7 tweets
29 Oct
1. Weekend Reading: In my last weekend thread I highlighted a 1990 AJAE article on the reaction of the live hog futures market to the release of quarterly Hogs and Pigs Reports. An oldie but goodie. Going to roll the clock forward almost 30 years to an update of that work.
2. Two points before getting to the new paper. First, I actually kept up the series on pre-release trade guestimates for HPRs for the last 30 years. Second, incredibly fortunate to team up with Berna Karali at Georgia and Olga Isengildina-Massa at VPI for the new work.
3. Now a methodological point. My 1990 AJAE article looked at "market surprises" as a measure of informational impact of HPR. Difference between pre-release guestimates and USDA #. Since that time, much of the literature has adopted a simpler approach.
Read 13 tweets

Did Thread Reader help you today?

Support us! We are indie developers!


This site is made by just two indie developers on a laptop doing marketing, support and development! Read more about the story.

Become a Premium Member ($3/month or $30/year) and get exclusive features!

Become Premium

Too expensive? Make a small donation by buying us coffee ($5) or help with server cost ($10)

Donate via Paypal

Or Donate anonymously using crypto!

Ethereum

0xfe58350B80634f60Fa6Dc149a72b4DFbc17D341E copy

Bitcoin

3ATGMxNzCUFzxpMCHL5sWSt4DVtS8UqXpi copy

Thank you for your support!

Follow Us on Twitter!

:(