Part of the reason people might be upset is that this is not true. Real wages are down ~1% since the pandemic.

Your data suffer from composition bias: about 5m generally lower-wage workers are no longer employed and not having them in the data spuriously raises wages.
Moreover, the important issue is not are real wages up but by how much. They rose ~1% annually pre-COVID. They're now 2.5%-3% below where they "should" have been. See my piece with with Willie Powell that tells the broad story.
piie.com/blogs/realtime…
There are important distributional issues: real wages do appear to be up for lower wage workers, although not quite as quickly as they were rising pre-COVID.

The rest of this thread is a technical appendix--I don't recommend anyone read it. Image
The Employment Cost Index (ECI) does not suffer from severe composition bias. It only has data for every 3 months and shows shows real wages +0.4% for Dec-2019 to Sep-2021 using CPI-U.

If we had data for Feb-2020 to Nov-2021 it likely would show -1.0% real wage growth.
1. Add Oct + Nov 2021: Avg hourly earnings were up 0.6% in the last 2 months. CPI was 0.9% in Oct & expected 0.7% in Nov. So real wages down 1% in last two months.

2. Remove Jan + Feb 2020: Avg hourly earnings up 0.4% in these two months.

(Note: above not composition adjusted.)
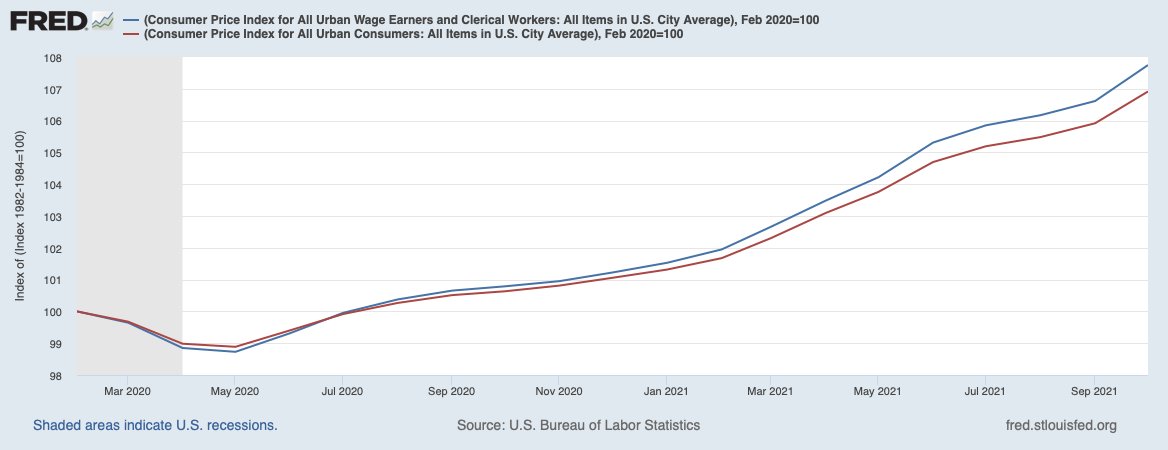
Also, @paulkrugman used CPI-U to deflate wages for production & non-supervisory workers. The BLS uses the CPI-W for this because it captures what these workers actually spend money on. It has grown 0.8% more than the CPI-U over this period. bls.gov/news.release/r… ImageImage
Note, I also used CPI-U because the ECI is all private workers, not just the prodn & non-supervisory workers (i.e., non-managers) in @paulkrugman's original tweet. If we had ECI for PNS & used CPI-W is plausible real wages would be down even more than 1% since pre-COVID.

FIN

• • •

Missing some Tweet in this thread? You can try to force a refresh
 

Keep Current with Jason Furman

Jason Furman Profile picture

Stay in touch and get notified when new unrolls are available from this author!

Read all threads

This Thread may be Removed Anytime!

PDF

Twitter may remove this content at anytime! Save it as PDF for later use!

Try unrolling a thread yourself!

how to unroll video
  1. Follow @ThreadReaderApp to mention us!

  2. From a Twitter thread mention us with a keyword "unroll"
@threadreaderapp unroll

Practice here first or read more on our help page!

More from @jasonfurman

10 Dec
CPI up 0.8% in November, 6.8% for the last 12 months. A lot of that was volatile energy which is coming down.

Core up 0.5%, or 4.9% for the last 12 months.

Stripping out some volatile pandemic items from core the underlying still quite high and broadly trending up. Image
Some items were unusually large in Nov & likely will be fall in the future (eg gasoline +6.1% & used cars at +2.5%).

But some items go the other way (rent/OER was 0.4% & that pace will almost certainly pick up, hospitals were -0.3% and transpo was 0.7% with more room to grow.)
One source of upward price pressure in November appears to have been the easing of the delta variant. The virus likely (but not definitely) reduced inflation in Aug/Sep/Oct. Pandemic services now rising again--but still have a ways to go.
Image
Read 7 tweets
3 Dec
Willie Powell & my blog on today's (confusing) jobs numbers. We put the last year in context. Contrary to widespread belief, job growth has been near expectations--as surprisingly strong labor demand offsets surprisingly weak labor supply. A 🧵 piie.com/blogs/realtime…
To understand what was expected we use the median forecast from the Survey of Professional Forecasters. Other forecasts were similar. Overall, has slightly outpaced. Here is avg monthly jobs for 2021:

Nov 2020 forecast: 432K/month
May 2021 forecast: 562K/month
Actual: 555K/month Image
Similar story for unemployment. Back in May (the first forecast that incorporated the American Rescue Plan) the SPF expected the UR to be about 4.9% in Nov, instead it was 4.2%.

(Note, they don’t forecast labor force participation but likely would be worse than expected.)
Read 10 tweets
24 Nov
I'm not writing any more economic threads until after Thanksgiving. I hope you're not reading any until after Thanksgiving either. But in case you're weird enough to want to use the break to catch up here is a thread of some recent threads. Enjoy--or even better don't!
I put my thoughts on inflation and the Fed together in a thread and many other formats. Short version: economy getting better, inflation is high and likely to be at least partly persistent, Fed should recalibrate towards less expansionary policy.
Underlying this is the argument that: (1) monetary policy is a continuum, (2) it is constantly changing and has become looser recently, and (3) there really is a risk of doing too much.
Read 13 tweets
24 Nov
Today's personal consumption data gives the most detailed picture of where consumers are now.

And the answer is: overall consumption is back, the goods-services disconnect is still large, but mostly that is because goods are high and rising even while services partly recover.
Here is real spending on goods and goods. Note that real services spending has been *rising* even while services spending is recovering.
Look at spending on sporting equipment, guns & ammunition vs. membership clubs and sports center. The former is high and the later is low. But the goods spending is still rising even while the services is roughly flat.
Read 10 tweets
24 Nov
New personal income data. Disposable personal income has mostly continued to rise as we see a handoff from income support like UI and checks to wages and compensation.

Inflation, however, has eroded DPI in recent months.

But even with inflation real DPI roughly on trend.
Nominal compensation is growing very rapidly (this is that analogue of nominal GDP being above trend, if we were targeting this we would be tightening monetary policy a lot). Even real is roughly on track.
Overall in nominal terms compensation has been cumulative about $1.5T above the pre-pandemic trend (originally mostly govt support). Consumption $0.9T below trend. So total excess saving are $2.4T. Not clear whether/when these spend out.
Read 4 tweets
24 Nov
New PCE price data (the Fed's target). Just 2 months ago the median FOMC forecast was for 3.7% core PCE inflation this yr. At the time they knew about delta/microchips/labor/etc. Implicitly they forecast 0.11%/month. Instead we got 0.25% in September and 0.43% in October.
At this point absent dramatic price reductions in November and December inflation for 2021 will be even higher than the median FOMC forecast that was made nine months into the year.

FOMC members have been shifting towards more balanced assessments, they should keep shifting.
Here are prices relative to trend. Even if you started your inflation averaging January 2015 we would still have already met averaging on a backward-looking basis. And based on expectations for the next five years the average is also being exceeded.
Read 4 tweets

Did Thread Reader help you today?

Support us! We are indie developers!


This site is made by just two indie developers on a laptop doing marketing, support and development! Read more about the story.

Become a Premium Member ($3/month or $30/year) and get exclusive features!

Become Premium

Too expensive? Make a small donation by buying us coffee ($5) or help with server cost ($10)

Donate via Paypal

Or Donate anonymously using crypto!

Ethereum

0xfe58350B80634f60Fa6Dc149a72b4DFbc17D341E copy

Bitcoin

3ATGMxNzCUFzxpMCHL5sWSt4DVtS8UqXpi copy

Thank you for your support!

Follow Us on Twitter!

:(