Today's personal consumption data gives the most detailed picture of where consumers are now.

And the answer is: overall consumption is back, the goods-services disconnect is still large, but mostly that is because goods are high and rising even while services partly recover.
Here is real spending on goods and goods. Note that real services spending has been *rising* even while services spending is recovering.
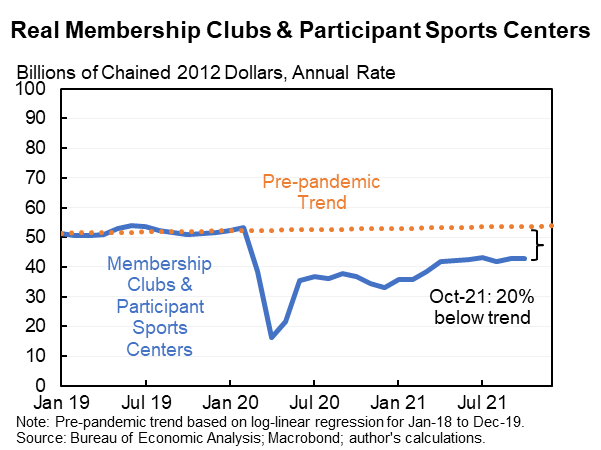
Look at spending on sporting equipment, guns & ammunition vs. membership clubs and sports center. The former is high and the later is low. But the goods spending is still rising even while the services is roughly flat.
Same story with personal care products vs. personal care services.
And my favorite, people kept buying a lot in supermarkets even as their restaurant spending returned to normal. I've tweeted about that before.
Also remember that the biggest shortfall in services is health. This isn't quite the same as people choosing not to go to gyms or manicures. And may not have the same obvious micro substitution. Although even ex health and nonprofits (which are in PCE), services below trend.
So overall the composition shift is clearly part of the story (people buying goods instead of services). But it's only part--as goods spending keeps rising while services is flat or recovering. So there is also a big demand increase (is screamingly clear in the nominal data).
We do still have an issue with the composition of consumption in our economy. As it shifts we're likely to see some falloff in goods inflation and some rise in services inflation. I expect that will mean lower inflation overall but is not obvious.
In fact, in Q3 the biggest shortfall in the economy was not consumption (which gets most of the attention) but business investment. With new orders so high this investment gap also may be closing rapidly.
Finally, here is a full table about what is up or down relative to trend in the consumption components--and how those contribute to the overall numbers. Enjoy!

• • •

Missing some Tweet in this thread? You can try to force a refresh
 

Keep Current with Jason Furman

Jason Furman Profile picture

Stay in touch and get notified when new unrolls are available from this author!

Read all threads

This Thread may be Removed Anytime!

PDF

Twitter may remove this content at anytime! Save it as PDF for later use!

Try unrolling a thread yourself!

how to unroll video
  1. Follow @ThreadReaderApp to mention us!

  2. From a Twitter thread mention us with a keyword "unroll"
@threadreaderapp unroll

Practice here first or read more on our help page!

More from @jasonfurman

24 Nov
I'm not writing any more economic threads until after Thanksgiving. I hope you're not reading any until after Thanksgiving either. But in case you're weird enough to want to use the break to catch up here is a thread of some recent threads. Enjoy--or even better don't!
I put my thoughts on inflation and the Fed together in a thread and many other formats. Short version: economy getting better, inflation is high and likely to be at least partly persistent, Fed should recalibrate towards less expansionary policy.
Underlying this is the argument that: (1) monetary policy is a continuum, (2) it is constantly changing and has become looser recently, and (3) there really is a risk of doing too much.
Read 13 tweets
24 Nov
New personal income data. Disposable personal income has mostly continued to rise as we see a handoff from income support like UI and checks to wages and compensation.

Inflation, however, has eroded DPI in recent months.

But even with inflation real DPI roughly on trend.
Nominal compensation is growing very rapidly (this is that analogue of nominal GDP being above trend, if we were targeting this we would be tightening monetary policy a lot). Even real is roughly on track.
Overall in nominal terms compensation has been cumulative about $1.5T above the pre-pandemic trend (originally mostly govt support). Consumption $0.9T below trend. So total excess saving are $2.4T. Not clear whether/when these spend out.
Read 4 tweets
24 Nov
New PCE price data (the Fed's target). Just 2 months ago the median FOMC forecast was for 3.7% core PCE inflation this yr. At the time they knew about delta/microchips/labor/etc. Implicitly they forecast 0.11%/month. Instead we got 0.25% in September and 0.43% in October.
At this point absent dramatic price reductions in November and December inflation for 2021 will be even higher than the median FOMC forecast that was made nine months into the year.

FOMC members have been shifting towards more balanced assessments, they should keep shifting.
Here are prices relative to trend. Even if you started your inflation averaging January 2015 we would still have already met averaging on a backward-looking basis. And based on expectations for the next five years the average is also being exceeded.
Read 4 tweets
24 Nov
Inflation would probably have been even higher without the rise of the delta variant.

Not open-and-shut: virus has reduced supply (inflationary), reduced demand (deflationary), and shifted demand (ambiguous).

The 2020 virus cut inflation, delta probably is doing so too.

A 🧵.
In 2020 prices actually fell in April & May when the virus first hit. The price of oil was actually negative! Inflation was low all year.

The conventional wisdom eight months ago was that the rapid reopening of the economy would cause a transitory *increase* in inflation.
Go back and read the analysis of the high inflation we had in April, May and June. The standard argument was that the vaccines were deployed more quickly and effectively than expected so that was temporarily increasing inflation. NO ONE said vaccines were reducing inflation.
Read 18 tweets
24 Nov
Big news in the GDP revision out this morning, *might* really change our understanding of Q3. Growth might have been much higher than the headline 2.1% GDP because another measure GDI up 6.7%. Best guess is true growth was the average: 4.4%. (All annual rates.)
The headline GDP measure is based on adding up all final sales (eg to consumers, businesses, etc.) The data is incomplete and measures have errors. Can be revised a lot over time. First estimate for Q3 was 2.0%, now revised to 2.1%.
There is another measure, Gross Domestic Income, that measures the size of the economy by adding up incomes for worker, profits for businesses, etc. In theory is identical to GDP, in practice differs due to measurement errors.
Read 7 tweets
23 Nov
Updated the blog Willie & I posted yesterday to add quits as a measure of labor market tightness (ty @MayankSeksaria). We added it--and the answer is it is the best or nearly the best predictor of nominal wages and Core CPI. piie.com/blogs/realtime…
This matters because quits is even more off-the-charts tight right now than even unemployment/job openings. Which is tighter than unemployment which is tighter than EPOP.
Here's a thread I did on our blog yesterday, doesn't have quits but all the same ideas apply--if anything is a little stronger now.
Read 4 tweets

Did Thread Reader help you today?

Support us! We are indie developers!


This site is made by just two indie developers on a laptop doing marketing, support and development! Read more about the story.

Become a Premium Member ($3/month or $30/year) and get exclusive features!

Become Premium

Too expensive? Make a small donation by buying us coffee ($5) or help with server cost ($10)

Donate via Paypal

Thank you for your support!

Follow Us on Twitter!

:(