1/ Another broken Covid claim.

Work done by @USMortality 😎

I just plot it here on a map. Same scale as my maps for Europe.

Note the he uses a German std. population (2020) while me ESP2013 or NL2011.

The timeframe is week 1 - current week 50 fro all years. Image
2/ Animated version.

The mortality in the east, is nothing new. The low vaccination rate has little to do with a problem that is seen 2016-2019 aswell.

Try with obesity/smoking maps to understand the issue...πŸ˜‰
3/ Here the full year data up to 2020.

What do we see: not getting vaccinated in 2021 already increased death rate in 2016-2019.

Magic time machine? πŸ˜€

No: the root cause for E-W, N-S mortality disparity has a different root cause than vaccines. Lifestyle, wealth,... Image
4/ Here it comes. The DE obesity map (2017) next to it on the right.

Can you see it? Berlin also shining green in the middle of unhealthiest (maybe result of poverty). Image
5/ Here is the correlation with % obesity in Germany.

Do we have correlation? And could it be causality as it happens every year and in every country?

I would say so. Image
6/ All years in one plot: The trend seems to worsen over the years. We may need more years to tell... Image

β€’ β€’ β€’

Missing some Tweet in this thread? You can try to force a refresh
γ€€

Keep Current with Orwell2024

Orwell2024 Profile picture

Stay in touch and get notified when new unrolls are available from this author!

Read all threads

This Thread may be Removed Anytime!

PDF

Twitter may remove this content at anytime! Save it as PDF for later use!

Try unrolling a thread yourself!

how to unroll video
  1. Follow @ThreadReaderApp to mention us!

  2. From a Twitter thread mention us with a keyword "unroll"
@threadreaderapp unroll

Practice here first or read more on our help page!

More from @orwell2022

16 Dec
1/ Syncing on @prof_shahar on the seasonal mortality.

I use a -26 week offset to define the season (basically September - September)

Let's start with Sweden. I also have one more (20/21) data point as compared with Prof. Shahar plot as I work with Sept-Sept. Image
2/ As a test we overlay.

Note that we have one month different season definitions. Small detail. I used 1st September as it seems to be the historical death minimum over years and countries. Image
3/ Now let's play. More countries.

And here we start to see interesting things like the disastrous performance of AUT, CH, FR on 20/21 season. Surprised me

We learn: locking down in 19/20 season makes 20/21 explode.

@DrJBhattacharya @MLevitt_NP2013 @MartinKulldorff won πŸ‘πŸ† Image
Read 5 tweets
14 Dec
1/ Netherlands real problem: demographics.

NL: The red line (crude mortality) is increasing. This is demographics driven. It manifest as ICU and hospital load before.

It can't be stopped.

It must be managed with elderly care infrastructure, and not by school closures. Image
2/ The std. mortality (blue) is continuously improving, although stagnating in NL as compared with top references Sweden and Norway.

Std. mortality depends on many health parameters like lifestyle and culture. Improving it is a slow process and won't stop red going up at ~1%. Image
3/ Both the red and blue curves are important.

Blue: monitors health. Here NL is doing fine.

Red: determines infrastructure load. It's the result of demographics and something that doesn't come unannounced. Here NL will be under pressure, for decades to come. Image
Read 6 tweets
9 Dec
1/ "Age adjusted all cause mortality trends 2000-2021 in Europe"

This was quite some work, so I hope you appreciate the article. I don't think that this kind of analysis using 5 year age bin granularity over 20 year trends has been done elsewhere.

orwell2024.substack.com/p/age-adjusted…
2/ The age adjustement was done on 5 year age bins.

Some groups @CebmOxford cebm.net/covid-19/exces… report age adjusted mortality for 2020. But the method is inaccurate as too wide age bins are used.
3/ For teaching purpose, we also applied the WHO2015-2025 standard population in some graphs to demonstrate the problem if applying this to an old population.
Read 16 tweets
8 Dec
1/ I spotted one little (manipulative?) move by @OurWorldInData using wayback machine. In July 2021 they change the colour code of the life expectancy world map.

June:
web.archive.org/web/2021062805…
July: web.archive.org/web/2021072013… Image
2/ Was Africa "too shiny" with yellow/red colour codes? Isn't the Wikipedia encoding much clearer @OurWorldInData ? Here again side by side.

"Nice tactics" by OWID to hide (see right) the lowest life expectancy countries:

Chad, Central African Republic, Somalia and Nigeria. ImageImage
3/ Very uselfeull this web.archive.org tool. @Bobby_Network πŸ˜‰
Read 4 tweets
30 Nov
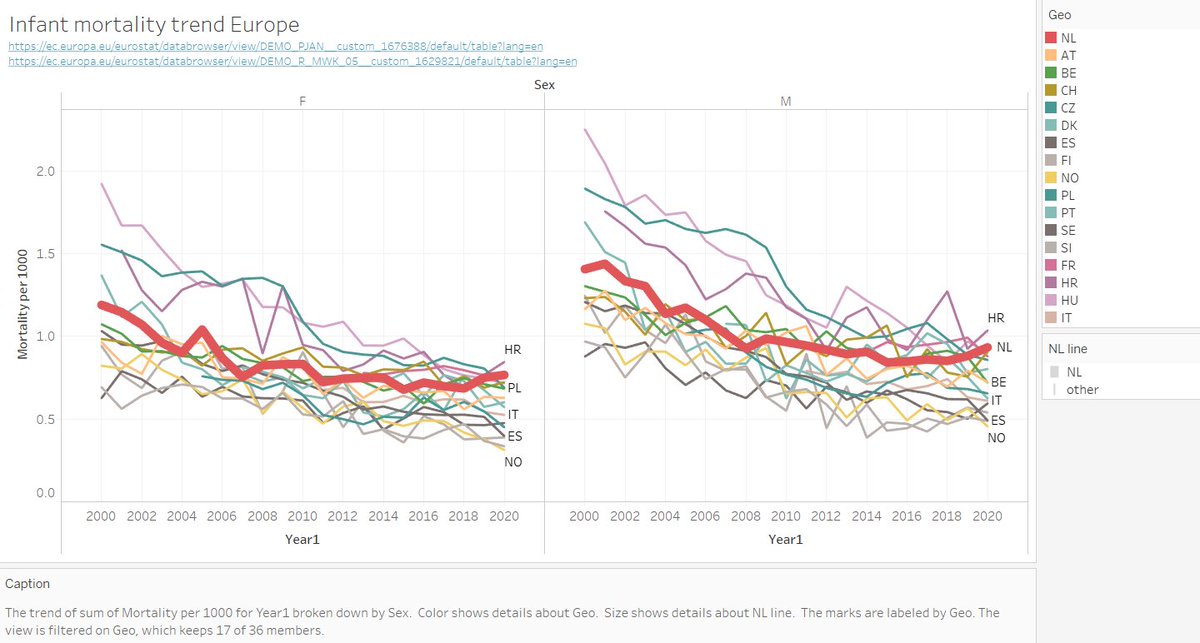
1/ Europe infant mortality trend. Let's have a look how NL compares with other peers.

Not so good.

Note that this is dominated by the 0-1 year group. But unfortunately, the population is only available by 0-5 years. So by averaging death_Y_LT5 / pop_LT5 we dilute a bit.
2/ Let's add some more countries. Romania and Bulgaria are on the way to leave NL behind.

I'm wondering what the plan is in NL @hugodejonge? Becoming the last soon?
3/ How does 2020 look like compared to peers?
Read 8 tweets
25 Nov
1/ Can we (theoretically) see vaccination deaths in all cause mortality? Difficult...

Let's take NL as example.

Even with a vaxx mortality of 1:10k (which is very high), we expect it to be buried in the background of mortality.

πŸ‘‰Maybe for <30y @OS51388957 @connolly_s
2/ The problem is that the vaccination will be diluted over many weeks.

I assumed that e.g. 10% of the population in an age group will vaccinate per week. Then this gives the expected weekly vaxx death background (red for 1:10k vaxx CFR-->1:100k, and blue 1:50k CFR-->1:500k).
3/ So we could maybe see it for the below 30y. But here, also the vaxx CFR is rather >>1:100k. So difficult. Maybe in cases when a lot of people vaccinated in the same week.

That's what @OS51388957 is hunting. He knows what he is doing. πŸ˜ŽπŸ€™πŸ’ͺ
Read 9 tweets

Did Thread Reader help you today?

Support us! We are indie developers!


This site is made by just two indie developers on a laptop doing marketing, support and development! Read more about the story.

Become a Premium Member ($3/month or $30/year) and get exclusive features!

Become Premium

Too expensive? Make a small donation by buying us coffee ($5) or help with server cost ($10)

Donate via Paypal

Or Donate anonymously using crypto!

Ethereum

0xfe58350B80634f60Fa6Dc149a72b4DFbc17D341E copy

Bitcoin

3ATGMxNzCUFzxpMCHL5sWSt4DVtS8UqXpi copy

Thank you for your support!

Follow Us on Twitter!

:(