Important Patterns in Dow Theory...
A Thread 🧵...
A Thread 🧵...
There are few important patterns in Dow Theory. Trader can use these patterns to identify trading opportunities. Some of the patterns are:
👉Double bottom & Double top formation
👉Triple Bottom & Triple Top
👉Range formation
👉Flag formation
Source Zerodha Varsity.
👉Double bottom & Double top formation
👉Triple Bottom & Triple Top
👉Range formation
👉Flag formation
Source Zerodha Varsity.
A double top & double bottom is considered a reversal pattern. A double bottom occurs when a stock’s price hits a shallow price level and rebounds back with a quick recovery.
Following the price recovery, the stock trades at a higher level (relative to the low price) for at least 2 weeks . After which the stock attempts to hit back to the low price previously made. If the stock holds up once again and rebounds, then a double bottom is formed.
A double bottom formation is considered bullish, and hence one should look at buying opportunities. Here is a chart that shows a double bottom formation in Cipla Limited:
Notice the time interval between the two bottom formations. The price level was well spaced in time.
Notice the time interval between the two bottom formations. The price level was well spaced in time.

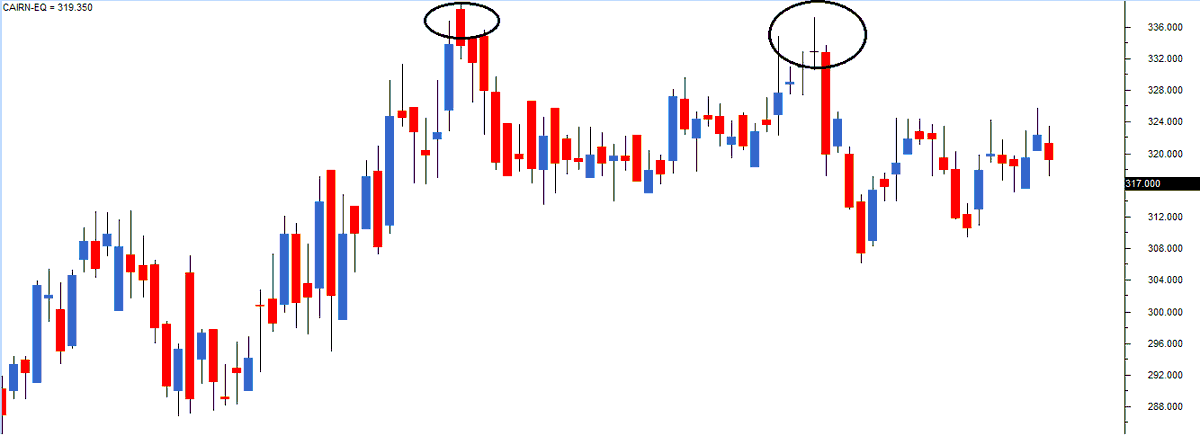
👉 In a double top formation, the stock attempts to hit the same high price twice but eventually sells off. Of course, the time gap between the two attempts of crossing the high should at least be 2 weeks.
In chart below (Cairn India Ltd), we can notice the double top at 336 levels. On close observation, u will notice the first top was around Rs.336, and the second top was around Rs.332. With some amount of flexibility, a small difference such as this should be considered alright.
👉Triple top and bottom
a triple formation is similar to a double formation, except that the price level is tested thrice as opposed twice in a double bottom. The interpretation of the triple formation is similar to the double formation.
a triple formation is similar to a double formation, except that the price level is tested thrice as opposed twice in a double bottom. The interpretation of the triple formation is similar to the double formation.
As a rule of thumb, the more number of times the price tests, and reacts to a certain price level, the more sacred the price level is considered. Therefore by this, the triple formation is considered more powerful than the double formation.
The following chart shows a triple top formation for DLF Limited. Notice the sharp sell-off after testing the price level for the 3rd time, thus completing the triple top.

Range Bound Market
The concept of the range is a natural extension to the double and triple formation. The stock attempts to hit the same upper and lower price level multiple times for an extended period of time in a range. This is also referred to as the sideways market.
The concept of the range is a natural extension to the double and triple formation. The stock attempts to hit the same upper and lower price level multiple times for an extended period of time in a range. This is also referred to as the sideways market.
However, the range provides multiple opportunities to trade both ways (long and short). The upside is capped by resistance and the downside by the support. Thus it is known as a range-bound or a trading market as there are enough opportunities for both the buyers and the sellers.

👉 Range Breakout
Stocks do break out of the range after being in the range for a long time. Before we explore this, it is interesting to understand why stocks trade in the range in the first place.
Stocks do break out of the range after being in the range for a long time. Before we explore this, it is interesting to understand why stocks trade in the range in the first place.
Stocks can trade in the range When there are no meaningful fundamental triggers that can move the stock, these triggers are quarterly/ annual result , new product launches, new expansions, mergers, acquisitions, etc. or When the market anticipates a big corporate announcement.
Think of the range as an enclosed compression chamber where the pressure builds up on each passing day. With a small vent, the pressure eases out with a great force. This is how the breakout happens. However, the trader needs to be aware of the concept of a ‘false breakout’.
A false breakout happens when the trigger is not strong enough to pull the stock in a particular direction. Loosely put, a false breakout happens when a ‘not so trigger friendly event’ occurs, and impatient retail market participants react to it.
Usually, the volumes are low on false range breakouts indicating; there is no smart money involved in the move. After a false breakout, the stock usually falls back within the range.
A true breakout has two distinct characteristics:
Volumes are high n After the breakout, momentum is high.
The stock attempted to break out of the range three times. However, the first two attempts were false breakouts.
Volumes are high n After the breakout, momentum is high.
The stock attempted to break out of the range three times. However, the first two attempts were false breakouts.
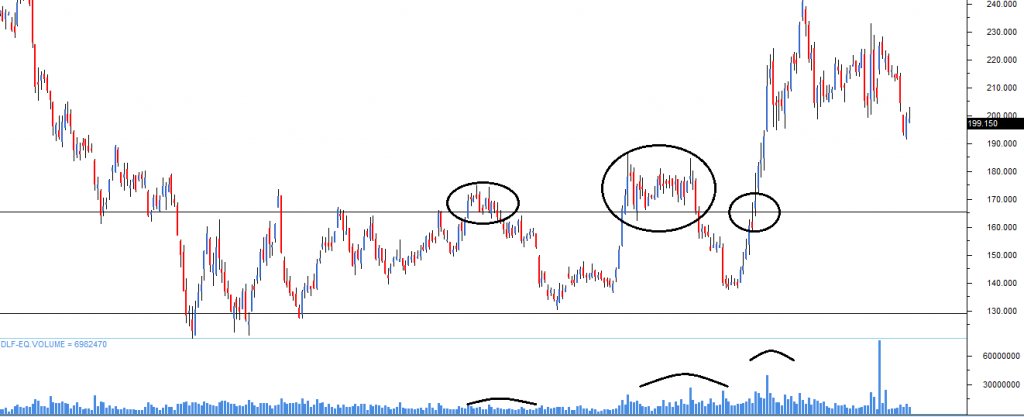
Low volumes and low momentum characterized the first 1st breakout (starting from left). The 2nd breakout was characterized by impressive volumes but lacked momentum.
However, the 3rd breakout had the classic breakout attributes, i.e. high volumes and high momentum.
However, the 3rd breakout had the classic breakout attributes, i.e. high volumes and high momentum.
👉Flag formation
The flag formation usually occurs when the stock posts a sustained rally with almost a vertical or a steep increase in stock prices. Flag patterns are marked by a big move which is followed by a short correction.
The flag formation usually occurs when the stock posts a sustained rally with almost a vertical or a steep increase in stock prices. Flag patterns are marked by a big move which is followed by a short correction.
In the correction phase, the price would generally move within two parallel lines. Flag pattern takes the shape of a parallelogram or a rectangle, and they have the appearance of a flag on the pole. The price decline can last anywhere between 5 and 15 trading sessions.

With these two events (i.e. price rally, and price decline) occurring consecutively a flag formation is formed. When a flag forms, the stock invariably spurts back suddenly and continues to rally upwards.
Thank you🙏
Thank you🙏
• • •
Missing some Tweet in this thread? You can try to
force a refresh