South Africa: I have made some calculation about the ratio of hospitalizations to cases in the #Omicron and #Delta waves.
TL;DR: The ratio is dependent on the pace of the spread and Omicron is so far just a little lower than Delta.
(1/x)
TL;DR: The ratio is dependent on the pace of the spread and Omicron is so far just a little lower than Delta.
(1/x)
I am using these data sets here:
Cases:
nicd.ac.za/wp-content/upl…
Hospitalizations Delta:
nicd.ac.za/wp-content/upl…
Hospitalizations Omicron:
nicd.ac.za/wp-content/upl…
(2/x)
Cases:
nicd.ac.za/wp-content/upl…
Hospitalizations Delta:
nicd.ac.za/wp-content/upl…
Hospitalizations Omicron:
nicd.ac.za/wp-content/upl…
(2/x)
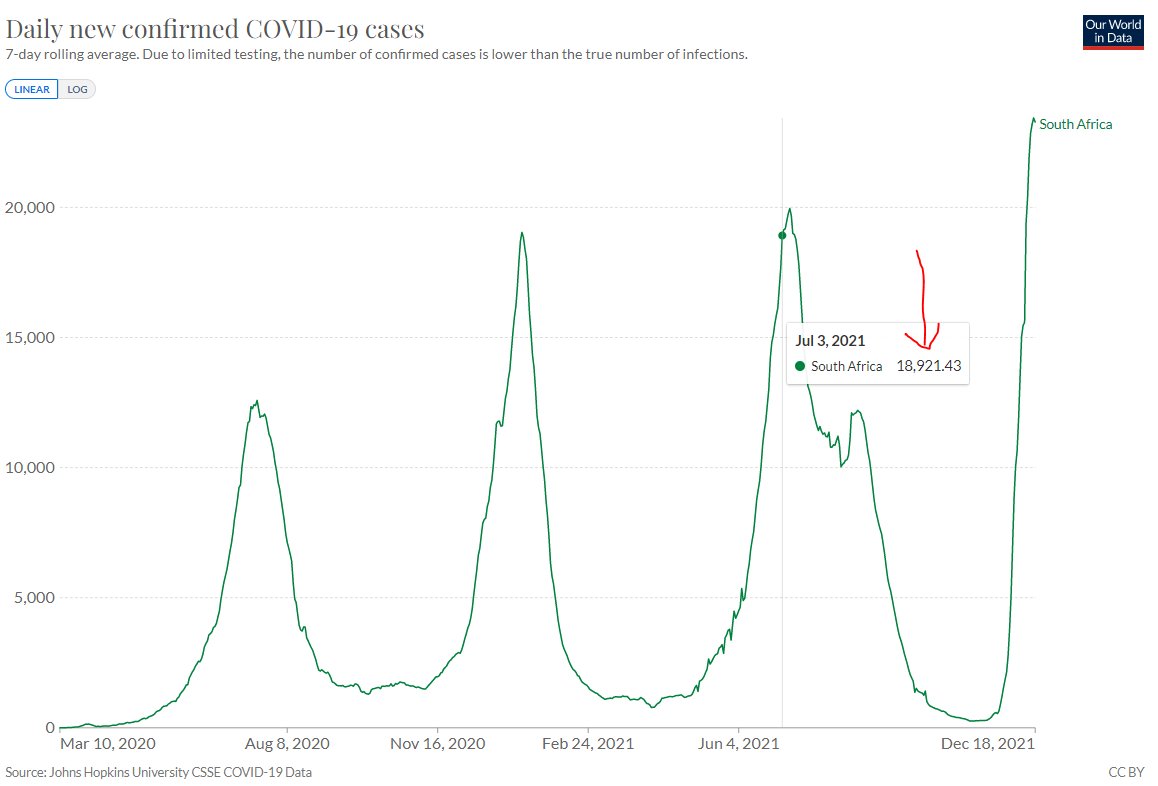
South Africa's presentation I commented on the last few days uses May 9 as a starting point for the #Delta wave.
On May 9, South Africa reported 1,790 new cases (7-day average).
That means the wave began with comparatively low growth by absolute numbers.
On May 9, South Africa reported 1,790 new cases (7-day average).
That means the wave began with comparatively low growth by absolute numbers.


South Africa uses a 25 day period for comparison at the start of the wave. I'll use four whole weeks, bc their website shows weekly data.
At the end of this 4-week comparison period, on June 5, they reported 4,631 new cases. Still rather low.
ourworldindata.org/coronavirus
(4/x)
At the end of this 4-week comparison period, on June 5, they reported 4,631 new cases. Still rather low.
ourworldindata.org/coronavirus
(4/x)


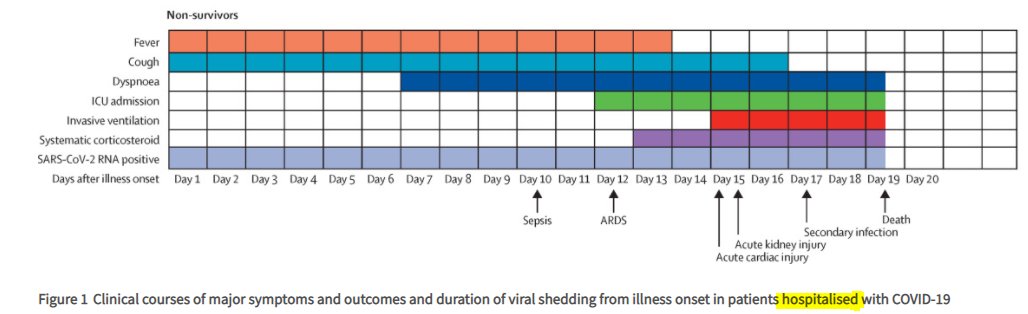
According to a @Nature paper, it takes median 8 days from onset of symptoms (probably a good proxy for a positive test) to hospitalization.
Now, let's look at the ratio of hospitalizations and cases with a 7-day lag period.
(5/x)
Now, let's look at the ratio of hospitalizations and cases with a 7-day lag period.
(5/x)
Ok, here come the numbers:
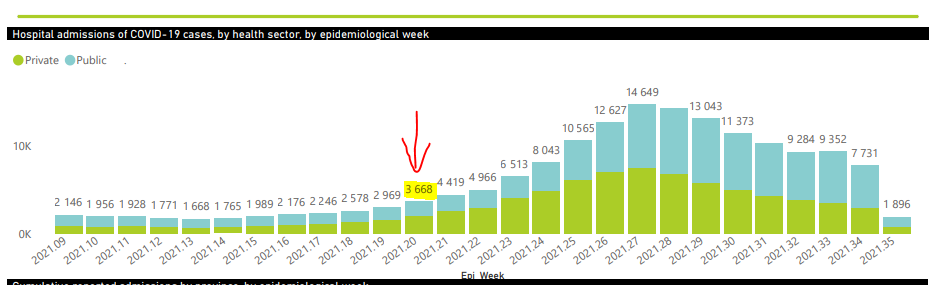
Epiweek 19: 19,935 cases
Epiweek 20: 3,668 hospitalizations
Ratio: 18%
(6/x)
Epiweek 19: 19,935 cases
Epiweek 20: 3,668 hospitalizations
Ratio: 18%
(6/x)

Now, let's do this for all four weeks.
Epiweek 19/20: 3,668/19,935 = 18%
Epiweek 20/21: 4,419/24,212 = 18%
Epiweek 21/22: 4,966/29,773 = 17%
Epiweek 22/23: 6,513/36,102 = 18%
Hospitalizations in % of the prior week's cases are hovering constantly around 18%.
(7/x)
Epiweek 19/20: 3,668/19,935 = 18%
Epiweek 20/21: 4,419/24,212 = 18%
Epiweek 21/22: 4,966/29,773 = 17%
Epiweek 22/23: 6,513/36,102 = 18%
Hospitalizations in % of the prior week's cases are hovering constantly around 18%.
(7/x)
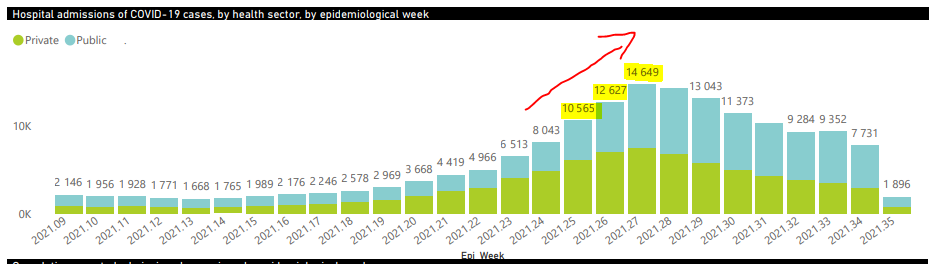
Now let's do this for the height of the ascending #Delta wave, when the case growth was much higher (epiweek 25-27 ending with 18,921 new cases), in fact in the neighborhood of the compared #Omicron wave in early December.
(8/x)
(8/x)


Let's do the same calculations here:
Epiweek 24/25: 10,565 / 87,937 = 12%
Epiweek 25/26: 12,627 / 118,488 = 11%
Epiweek 26/27: 14,649 / 146,543 = 10%
(9/x)
Epiweek 24/25: 10,565 / 87,937 = 12%
Epiweek 25/26: 12,627 / 118,488 = 11%
Epiweek 26/27: 14,649 / 146,543 = 10%
(9/x)


Now, isn't this interesting?
If we have faster case growth, the ratio of hospitalizations to cases from the prior week DROPS.
On the height of the wave, it's down to 10%, from 18% a few weeks earlier, when cases did not grow as quickly.
(10/x)
If we have faster case growth, the ratio of hospitalizations to cases from the prior week DROPS.
On the height of the wave, it's down to 10%, from 18% a few weeks earlier, when cases did not grow as quickly.
(10/x)
This makes sense, because if you cases grow very fast, a lot of people get sick, but do not yet arrive at the hospital by the next week.
Is this what is happening right now? Let's look at the numbers.
(11/x)
Is this what is happening right now? Let's look at the numbers.
(11/x)
Same calculations for the #Omicron wave
Epiweek 46/47: 1,404 / 4,741 = 29%
Epiweek 47/48: 3,905 / 18,775 = 21%
Epiweek 48/49: 7,173 / 95,639 = 8%
Bingo. Same pattern.
When cases grow more quickly, it looks like hospitalizations don't keep up. But they do. Eventually.
(12/x)
Epiweek 46/47: 1,404 / 4,741 = 29%
Epiweek 47/48: 3,905 / 18,775 = 21%
Epiweek 48/49: 7,173 / 95,639 = 8%
Bingo. Same pattern.
When cases grow more quickly, it looks like hospitalizations don't keep up. But they do. Eventually.
(12/x)


The growth of hospitalizations and cases is entirely consistent with a wave that will be just as severe as the #Delta wave.
That cases may have peaked in #Gauteng doesn't change anything. Those who will be hospitalized in the next 1-2 weeks have already been infected.
(13/13)
That cases may have peaked in #Gauteng doesn't change anything. Those who will be hospitalized in the next 1-2 weeks have already been infected.
(13/13)
Maybe one addendum to this threat:
Not sure how exactly that plays out mathematicall, but I think what matters for the % number calculated above is not the absolute number of new cases during that week, but the ACCELERATION in case growth.
Not sure how exactly that plays out mathematicall, but I think what matters for the % number calculated above is not the absolute number of new cases during that week, but the ACCELERATION in case growth.
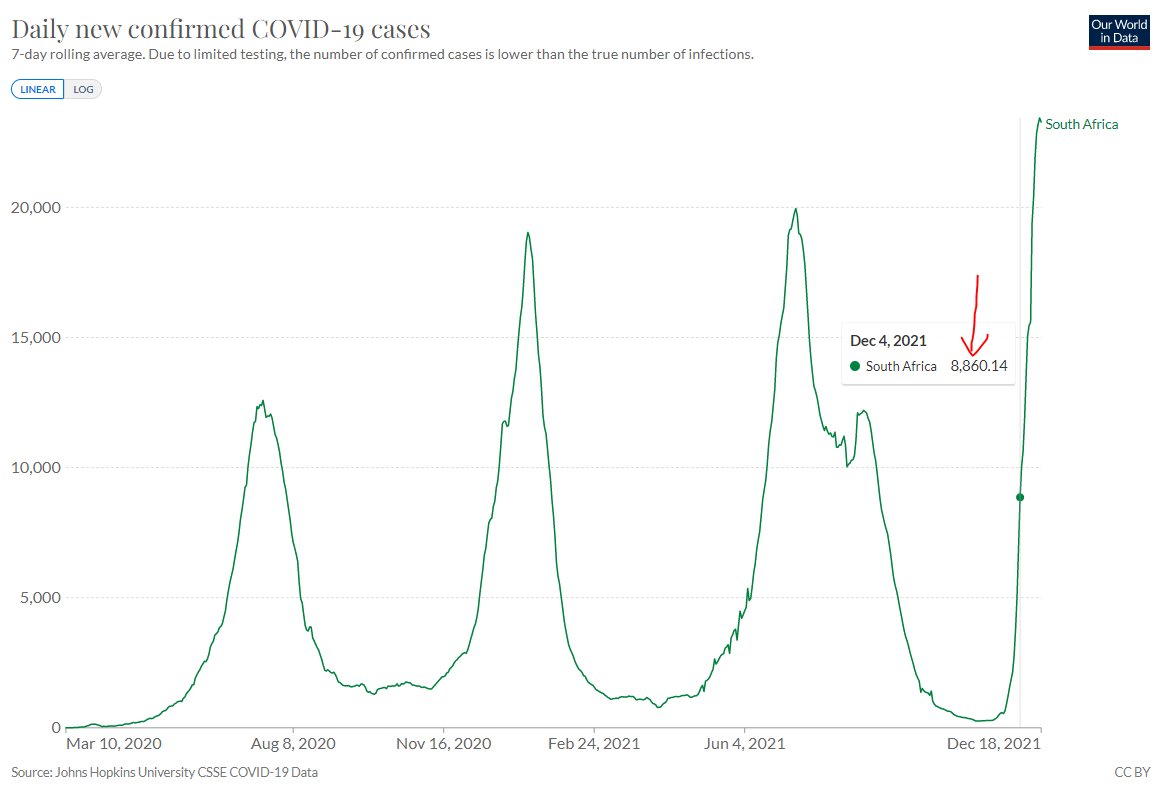
Epiweek 48 started on November 28 with 1,851 cases (7 day average) and ended on December 4 with 8,860 cases.
I think this ACCELERATION is why the % number is just 8% and it looks like hospitalizations are falling. But they are not. They will appear in the coming week(s).
I think this ACCELERATION is why the % number is just 8% and it looks like hospitalizations are falling. But they are not. They will appear in the coming week(s).

I think is has to do with the left-skewed distribution of cases in the week during the #Omicron wave.
If case growth accelerates substantially during the week, a high proportion of cases come in in second half of the week and may therefore not be hospitalized in the next week.
If case growth accelerates substantially during the week, a high proportion of cases come in in second half of the week and may therefore not be hospitalized in the next week.
And that's why a comparison with the BEGINNING of the #Delta wave is problematic. Case growth accelerated rather slowly.
A better comparison for the #Omicron wave is the height of the ascension of the #Delta wave (epiweeks 25-27) when growth acceleration was similar to #Omicron.
A better comparison for the #Omicron wave is the height of the ascension of the #Delta wave (epiweeks 25-27) when growth acceleration was similar to #Omicron.
I am quite confident that if hospitalization ratios and other severe outcomes were compared with #Omicron from that period, it would match very consistently.
• • •
Missing some Tweet in this thread? You can try to
force a refresh