Short THREAD on log scales and why I tend not to use them.

I've been criticised at times for not plotting case numbers etc on a log scale. I want to explain why.

TLDR: essentially it's because the burden of covid ill health and on NHS is people not log people. 1/8
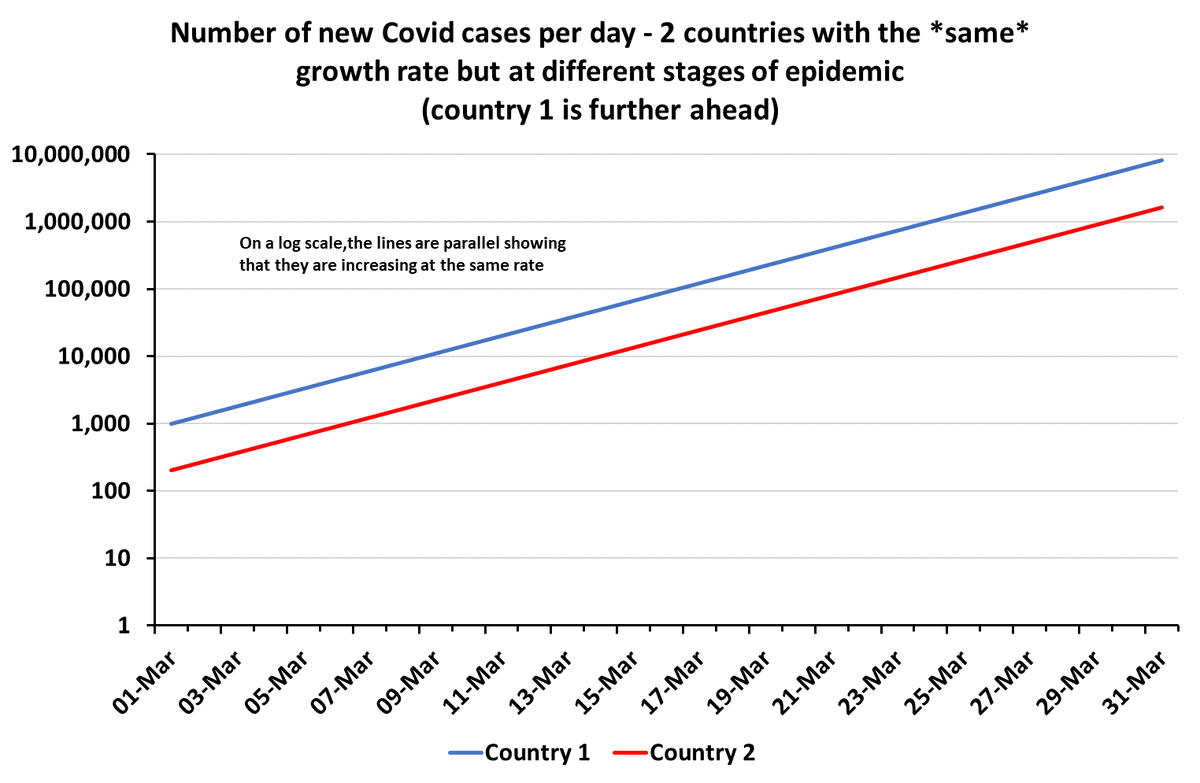
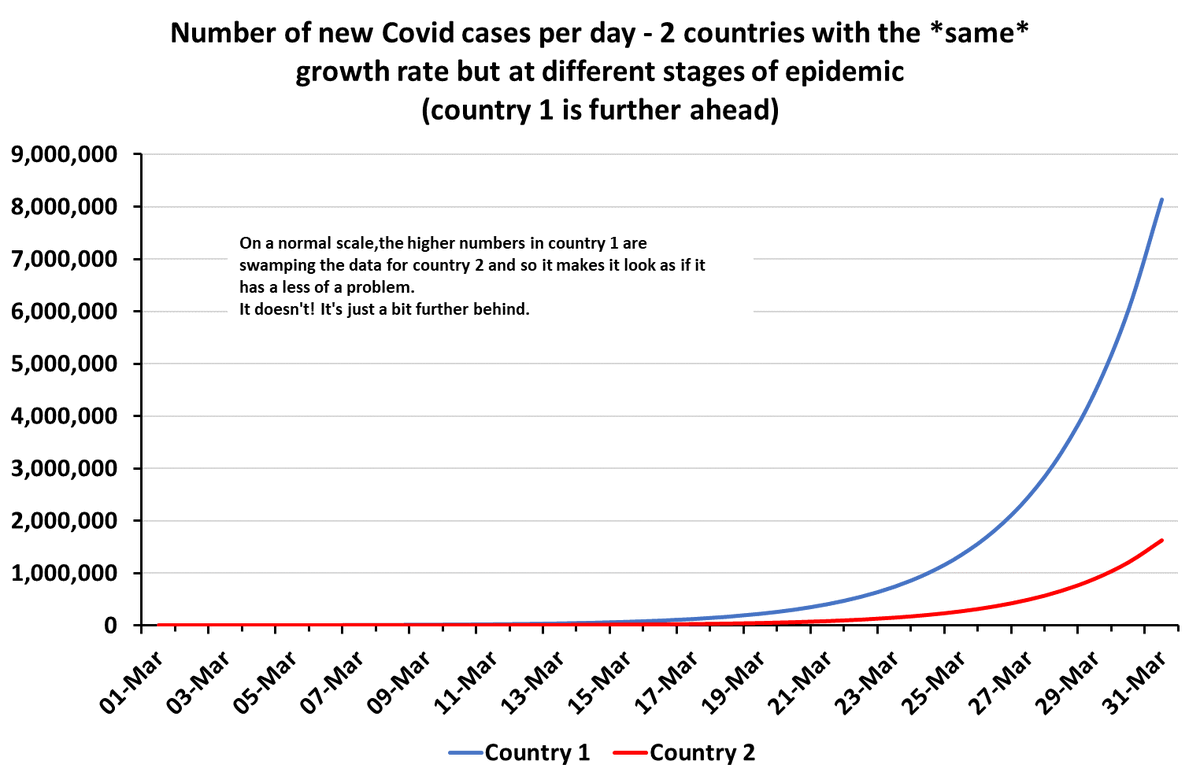
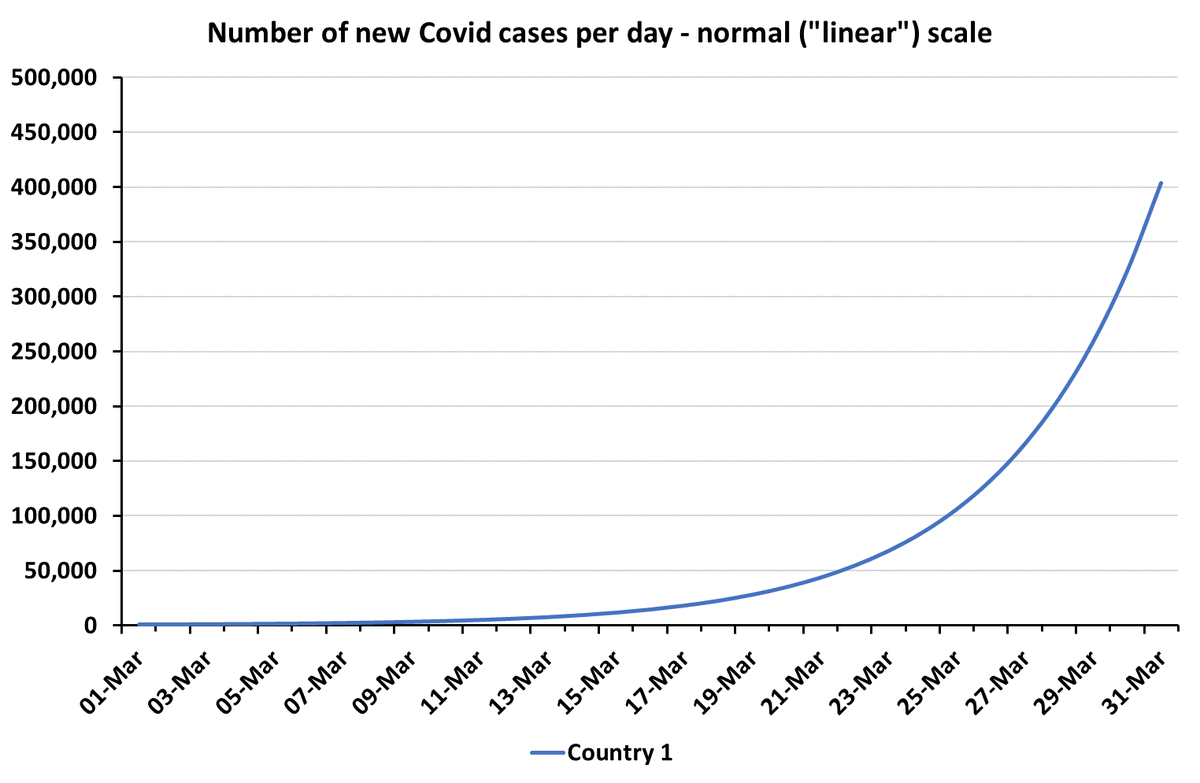
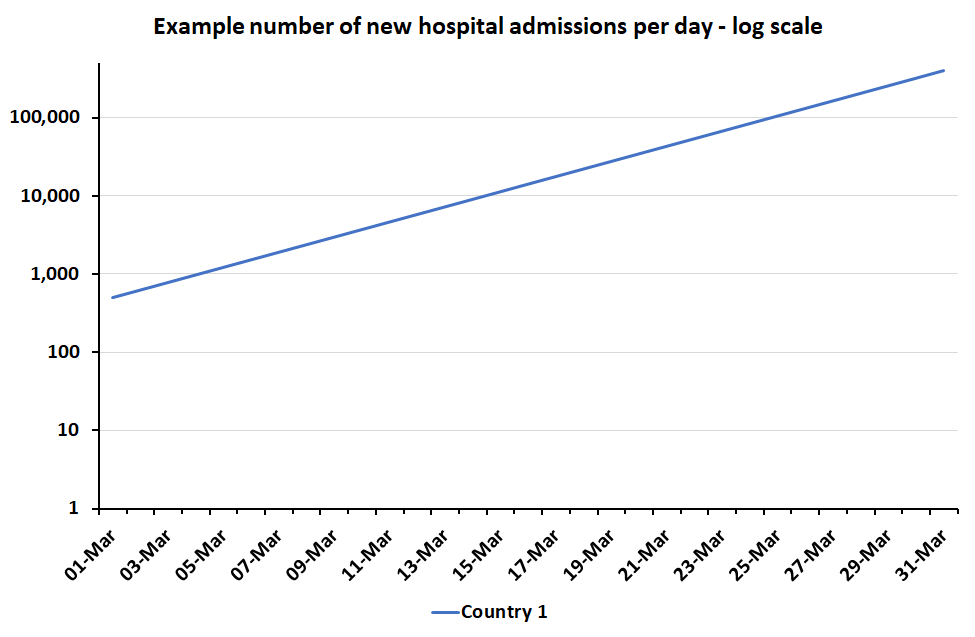
When you've got exponential growth (e.g. in new covid cases or hospital admissions, it will be a straight line if you put the vertical axis on a "log scale" (normally equally spaced powers of 10).

Charts show same exponential growth on a normal scale and a log scale. 2/8
Log scales are really useful for e.g:

a) seeing if growth is exponential (straight line?)
b) looking for acceleration or slow down in growth
c) comparing growth between countries at different stages of epidemic 3/8
And if I'm trying to do those things I will use log scales and (sometimes) share log scale plots.

But often I stick to normal ("linear") scales and explain that growth rates are equal or that growth is exponential etc in words instead.

Why? 4/8
Firstly, most people don't look at data charts very often.
So I try to make mine as intuitive & foolproof as possible. Most people haven't done logs since they were teenagers & don't remember how they work.
Logs are also NOT intuitive. Our brains don't work that way really. 5/8
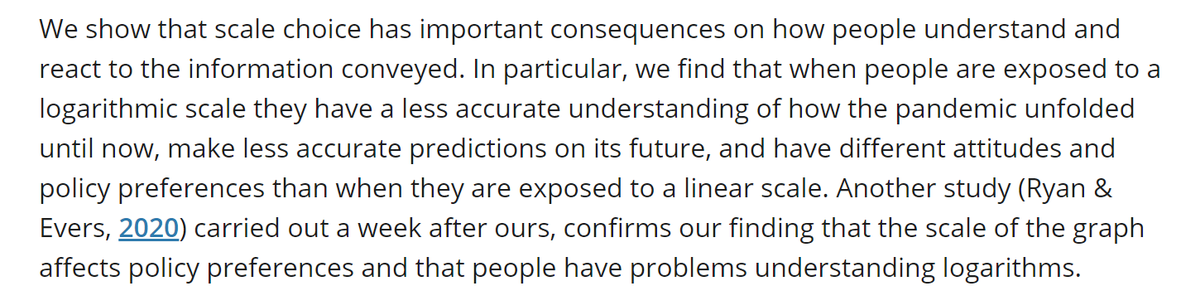
You can label your charts brilliantly on log scales, but often people react as if they are still showing you *linear* effects - not exponential ones. This means that people might instinctively underestimate the scale of the problem.

E.g.onlinelibrary.wiley.com/doi/full/10.10… 6/8
Finally, the *impact* of exponential growth in ill health is on people. They don't come in logs.

Impact is exponentially worse the longer exponential growth continues. Acting early makes a HUGE difference.

Linear scales do a better job of showing that than log scales. 7/8
If your audience is people who have adapted to log scales then logs are fantastic. I avidly follow many people here who use them because I find them very informative.

But for a general audience who might spend 10 seconds looking at your chart, I much prefer linear. 8/8

• • •

Missing some Tweet in this thread? You can try to force a refresh
 

Keep Current with Prof. Christina Pagel

Prof. Christina Pagel Profile picture

Stay in touch and get notified when new unrolls are available from this author!

Read all threads

This Thread may be Removed Anytime!

PDF

Twitter may remove this content at anytime! Save it as PDF for later use!

Try unrolling a thread yourself!

how to unroll video
  1. Follow @ThreadReaderApp to mention us!

  2. From a Twitter thread mention us with a keyword "unroll"
@threadreaderapp unroll

Practice here first or read more on our help page!

More from @chrischirp

21 Dec
THREAD on cases, hospital admissions and why so many scientists & NHS leaders are worried.

Case study of London - and what is behind the alarm!

1/10 Image
The key bit is that it takes about 10-14 days from infection to needing hospital. And if you have symptoms, you'll probably test positive 4-7 days into infection.

So there's roughly a week from testing positive to becoming a hospital admission. 2/10 Image
So - cases in London have risen *very steeply* - but *mainly* in the last week. And only in the most recent week has Omicron been dominant.

But cases to 19 Dec (incomplete!) are already more than double previous week. 3/10 Image
Read 10 tweets
17 Dec
THREAD: on omicron, UK cases, London & what to do next...

Last post-briefing tweet thread of the year! 1/18
First Omicron... as of 11 December, Omicron was most common in Scotland and England but starting its growth in Wales & N Ireland. With its growth speed, shares of cases will now be much higher in all regions. 2/18
In England, UKHSA "S gene dropout" data shows it was 40% of cases by 13 DEcember. It will be dominant in England by now.

WHO first designated it a variant of concern & named it Omicron 3 weeks ago today. Crazy. 3/18
Read 18 tweets
16 Dec
SHORT THREAD: Some basic musings about hospital admissions and exponential growth.

88K cases reported today - let's assume just under half are Omicron - so ~40K. Delta hospital admissions have been running at about 1.7% of reported cases in last month. 1/5
Let's assume Omicron was half as likely to cause hospital admission as Delta. So 0.8% of reported cases end up in hospital. From 40K cases today that would result 340 admissions.

just FOUR doublings takes you to 5,440 admissions - far higher than last January peak. 2/5
The 40K cases today represent people infected about a week ago. Omicron has been doubling every 2 days. Even if that's slowed this week to 3 days, that's likely 2 more doubling baked into admissions. That means that FROM NOW we there'd be two more doublings exceeding jan peak 3/5
Read 6 tweets
16 Dec
Four charts about why boosters can't do everything on their own.

1. There is a massive difference in booster uptake between the most and least deprived areas. And also a massive difference in those entirely unvaccinated.

What is plan to reach them? 1/4
2. There are big regional variations. London has the highest unvaccinated and least boosted population by far. It is also where epicentre of Omicron currently sits. There are far too many vulnerable people left in London. 2/4
3. There are big age differences that will take time to smooth out - even with our current booster acceleration.

In London (below), far too many teens remain unvaccinated and far too few over 50s boosted. 3/4
Read 5 tweets
12 Dec
THREAD on UK covid situation, Omicron and what's happening...

TLDR: Omicron increasing very fast and we are getting increasing evidence of significant ability to infect previously infected or vaxxed people.

Expect UK response to change rapidly in response. 1/10
First, UK cases are climbing, back to near January pandemic peak levels. Scotland and England are rising fastest in recent days.

In England, London is rising faster than other regions.

Cases highest in 5-14 yr olds but rising fast in 20 somethings recently... 2/10
As of end last week, people in hospital going down everywhere except England, where admissions are now going up, driven by 18-64 year olds.

Unfortunately, if cases go up sharply in next few weeks, admissions will follow. By how much is the question... 3/10
Read 11 tweets
11 Dec
Quick thread on some omicron thoughts with @BBCNews today.

1. At population level, Omicron's sheer growth advantage is likely to outweigh any reduction in severity from existing immunity, at least in short term. More covid patient to NHS -> less NHS for everything else.
2. We can do more and we should do more - but how much more is the really hard question.
3. But *when* govt might do something is much harder to answer because Christmas is round the corner. If this were any other time, I suspect we'd there would be more public health measures in place already.
Read 4 tweets

Did Thread Reader help you today?

Support us! We are indie developers!


This site is made by just two indie developers on a laptop doing marketing, support and development! Read more about the story.

Become a Premium Member ($3/month or $30/year) and get exclusive features!

Become Premium

Too expensive? Make a small donation by buying us coffee ($5) or help with server cost ($10)

Donate via Paypal

Or Donate anonymously using crypto!

Ethereum

0xfe58350B80634f60Fa6Dc149a72b4DFbc17D341E copy

Bitcoin

3ATGMxNzCUFzxpMCHL5sWSt4DVtS8UqXpi copy

Thank you for your support!

Follow Us on Twitter!

:(