Not great that the health authority that already struggled to deal with the logistics of a surge in cases struggles to deal with the logistics of four inches of snow
https://twitter.com/vchhealthcare/status/1475952133887328258
bc’s big brains have been stymied by long forecasted heat, water and snow events in the last six months
we’re running out of weather to test ourselves on
we’re running out of weather to test ourselves on
am I being a bit snarky?
me never
but access to testing, purchasing rapid tests, and getting third doses seems to be the bread and butter of the response in a bunch of places right now
and it's just a different reality in Vancouver
me never
but access to testing, purchasing rapid tests, and getting third doses seems to be the bread and butter of the response in a bunch of places right now
and it's just a different reality in Vancouver
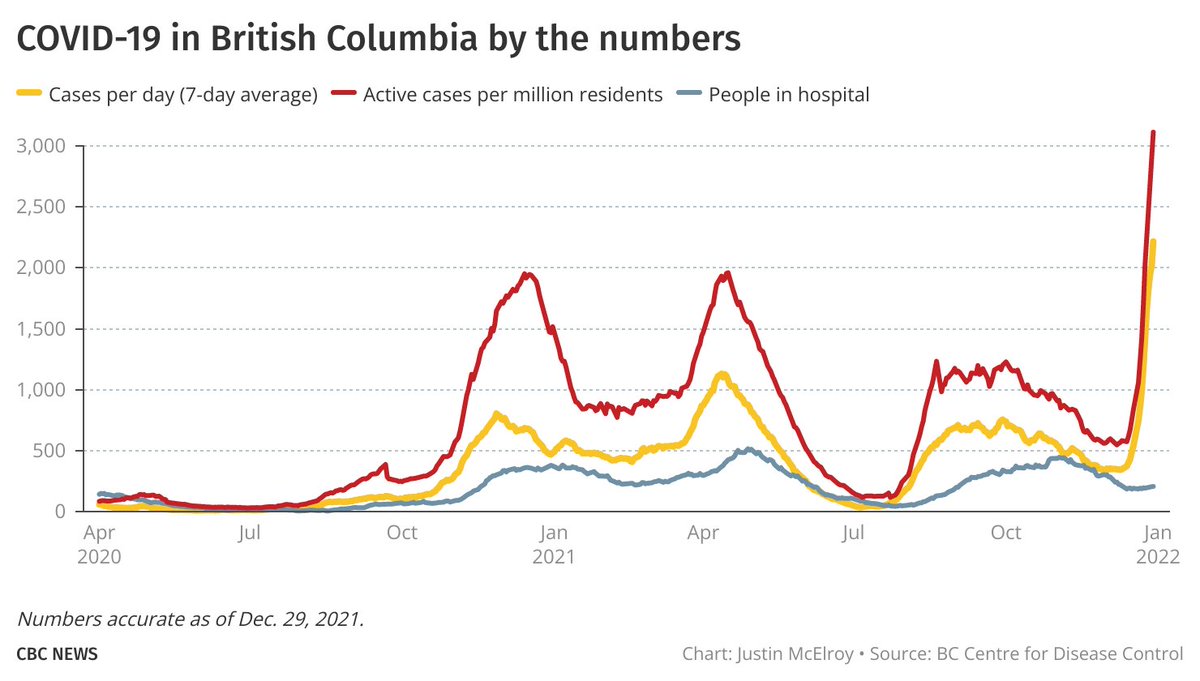
anyhow it's 4pm and the numbers are late
still no numbers, but the B.C. government has just announced a Dix/Henry press conference for 3pm tomorrow
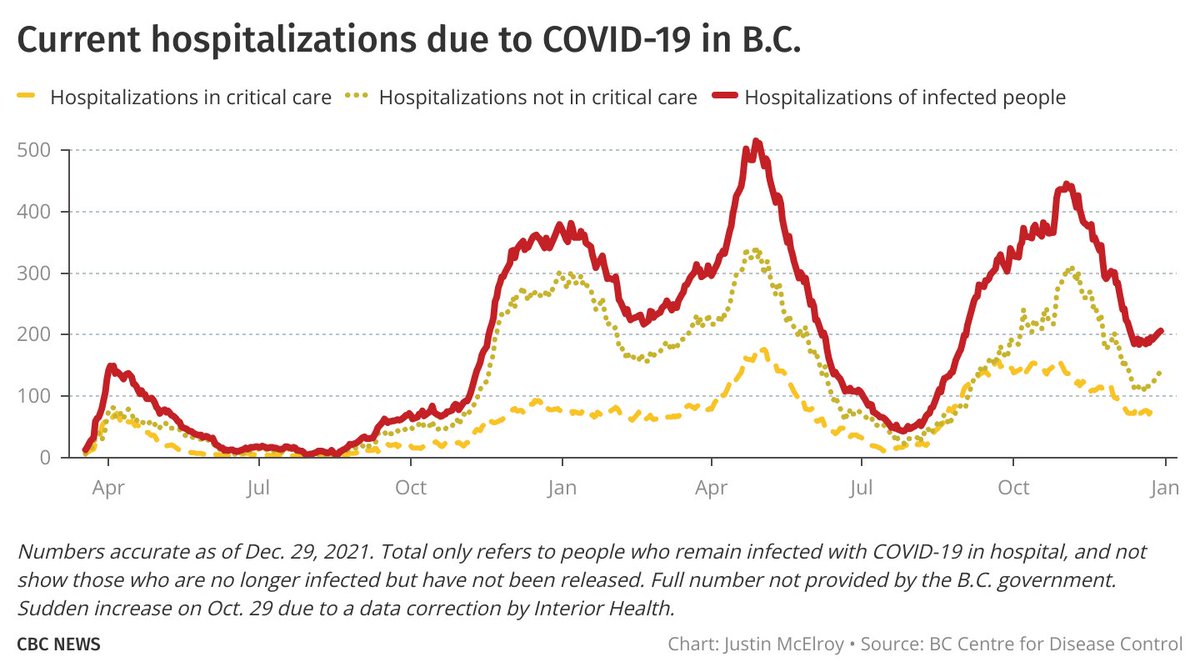
one would expect we will get the details about hospitalizations/testing over the past five days around that time as well
one would expect we will get the details about hospitalizations/testing over the past five days around that time as well
• • •
Missing some Tweet in this thread? You can try to
force a refresh