NEW: first thread of 2022 is an Omicron situation update, starting with a detailed look at UK hospitals, before going international.
Let’s start with severity, and the most important chart:
Despite steep rises in cases and patients, the number on ventilators has barely risen.
Let’s start with severity, and the most important chart:
Despite steep rises in cases and patients, the number on ventilators has barely risen.
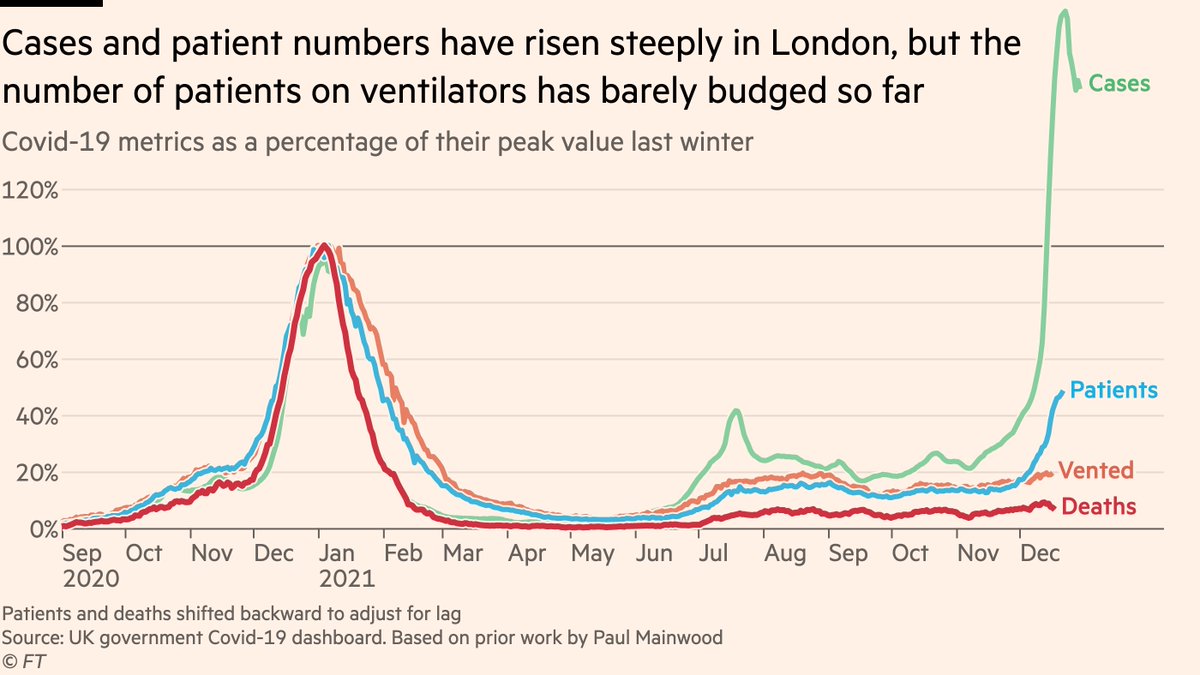
I’ve adjusted for lag between positive test and severe disease, so the divergence between patients and ventilated is a marked difference between this and previous waves when they were in lockstep.
The link between cases and severe disease has significantly weakened with Omicron.
The link between cases and severe disease has significantly weakened with Omicron.
We also continue to track "excess ICU pressure" — total number of people in ICU, for any reason, Covid or otherwise, compared to past winters:
Latest data show that the number of people in London ICUs has fallen in recent weeks, and is not following the same path as last winter.
Latest data show that the number of people in London ICUs has fallen in recent weeks, and is not following the same path as last winter.
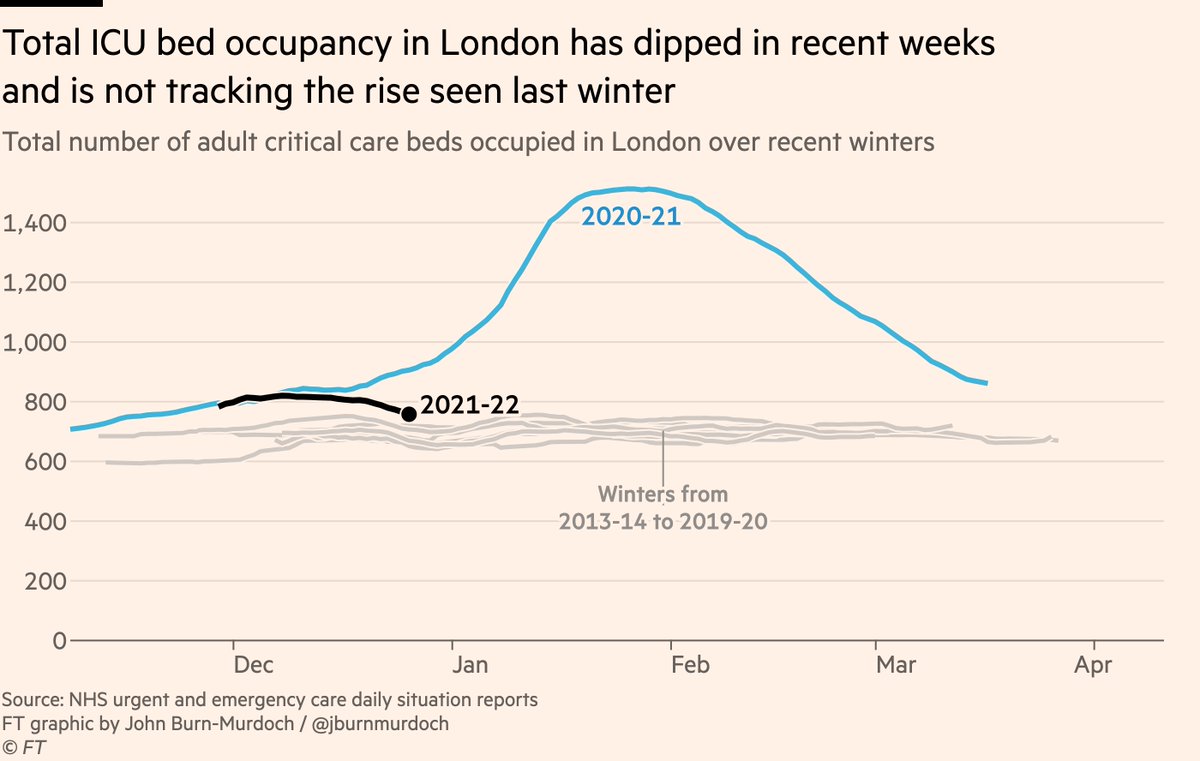
So that’s two very strong signals that this wave is not the same as those that have come before it in terms of severe disease and the pressure placed on ICUs.
This is unambiguously good news!
But... as with everything in this pandemic, once we dig deeper it gets complicated.
This is unambiguously good news!
But... as with everything in this pandemic, once we dig deeper it gets complicated.
There are many caveats, and that’s before we get onto the wider pressures facing NHS (read on for the deep dive into that)...
First is age: cases have turned the corner among young adults, but rates among elderly have kept climbing, rising more than 10x among over-80s to Jan 2
First is age: cases have turned the corner among young adults, but rates among elderly have kept climbing, rising more than 10x among over-80s to Jan 2
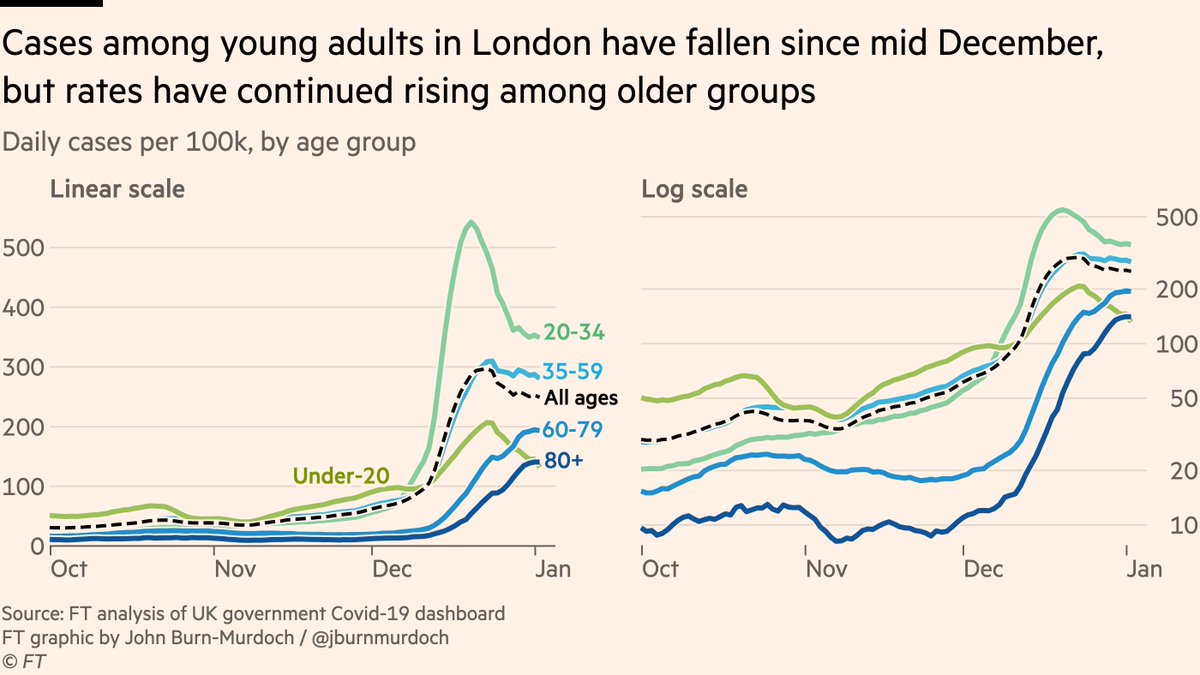
And just as night follows day, this has fed into hospital admissions.
In the last few days the share of admissions among people aged 65+ has ticked upwards.
We know Covid has a steep age gradient, so this may increase the share of patients whose condition becomes serious.
In the last few days the share of admissions among people aged 65+ has ticked upwards.
We know Covid has a steep age gradient, so this may increase the share of patients whose condition becomes serious.

(it may also be worth noting here that a study from Gauteng, South Africa, last week found that the reduction in severity among hospital patients was smaller among over-60s than among young adults
https://twitter.com/miamalan/status/1476535940378152965)
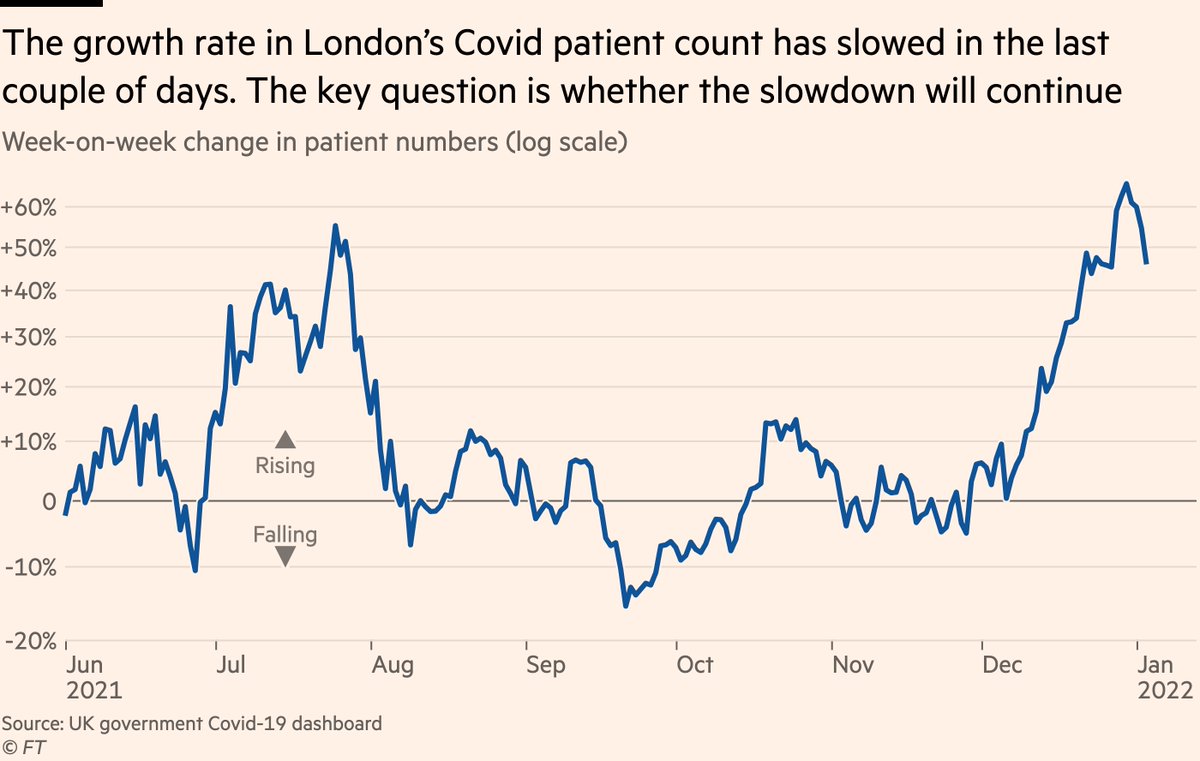
That incoming age shift may cause severe disease numbers to tick upwards in the next week or two, but on the flip-side the growth in Covid-positive patient counts in London has slowed in recent days, and if this holds, these shifts may balance one another out to an extent.
So, less severe disease this winter than last, but as @ChrisCEOHopson has painstakingly explained, this doesn’t mean everything is fine in hospitals. Far from it, in fact.
Let‘s take a look at the different pressures facing the NHS this time around:
Let‘s take a look at the different pressures facing the NHS this time around:
https://twitter.com/ChrisCEOHopson/status/1477263164547166208
First of all, the sheer volume problem:
Whilst it’s true that the number of 'incidental' Covid patients — people being treated primarily for another reason — has risen steeply during Omicron wave, the number with serious Covid is also now rising very quickly.
Whilst it’s true that the number of 'incidental' Covid patients — people being treated primarily for another reason — has risen steeply during Omicron wave, the number with serious Covid is also now rising very quickly.
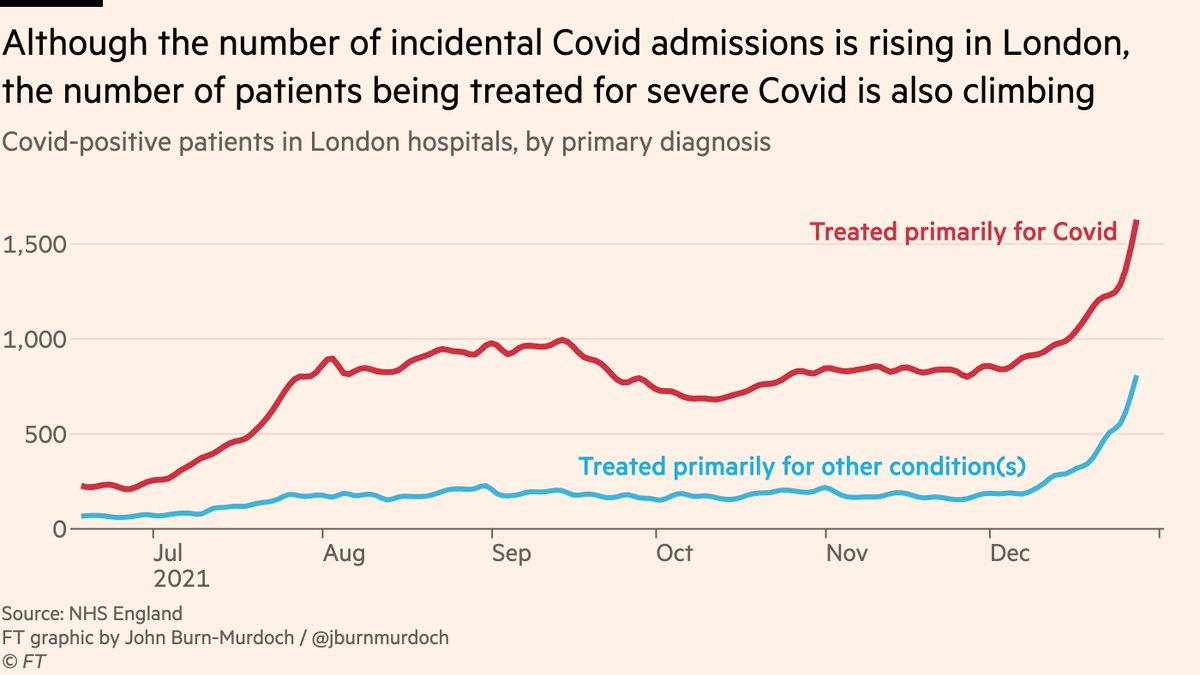
(and an important note: incidental patients still matter. Their Covid-positive status is a major complicating factor for a) their non-Covid treatment and b) hospital resource management
https://twitter.com/kit_delgadoMD/status/1477849508763643906)
So if soaring patient numbers is the demand side, the supply side is the number of NHS staff available to treat them.
The number of hospital staff absent due to Covid (either sick or isolating) has shot up in the last week or two, setting new records in several hospitals.
The number of hospital staff absent due to Covid (either sick or isolating) has shot up in the last week or two, setting new records in several hospitals.
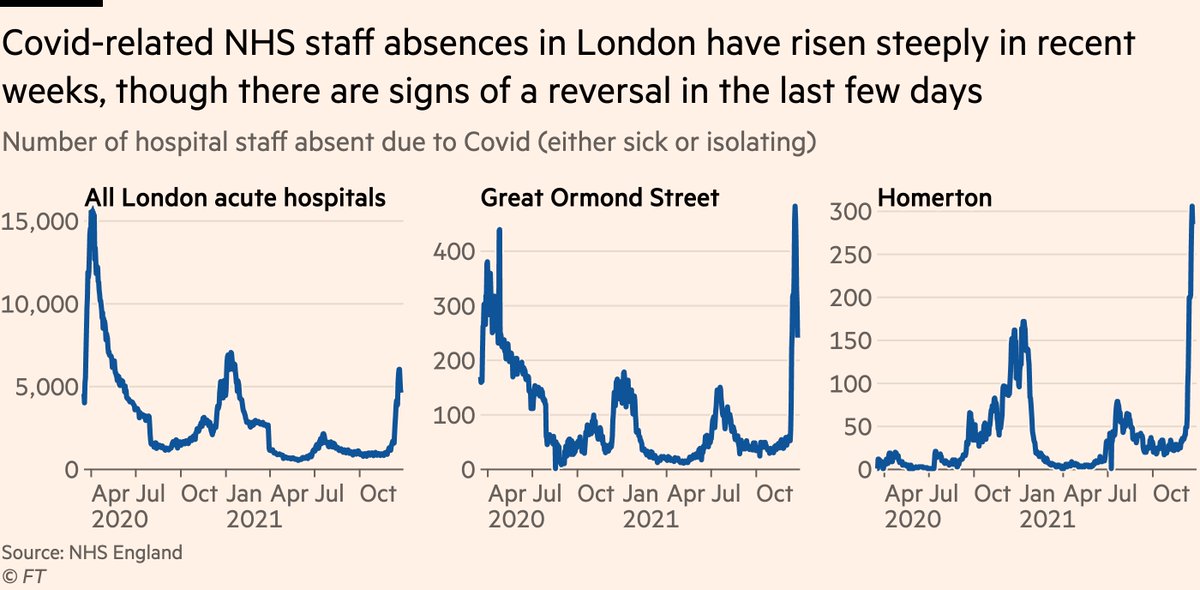
(To combat this, I agree with @timspector’s call to reduce the length of isolation for hospital staff who come into contact with a known case. Obviously this would be conditional on not developing symptoms and continuing to test negative
https://twitter.com/timspector/status/1477998596171644936)
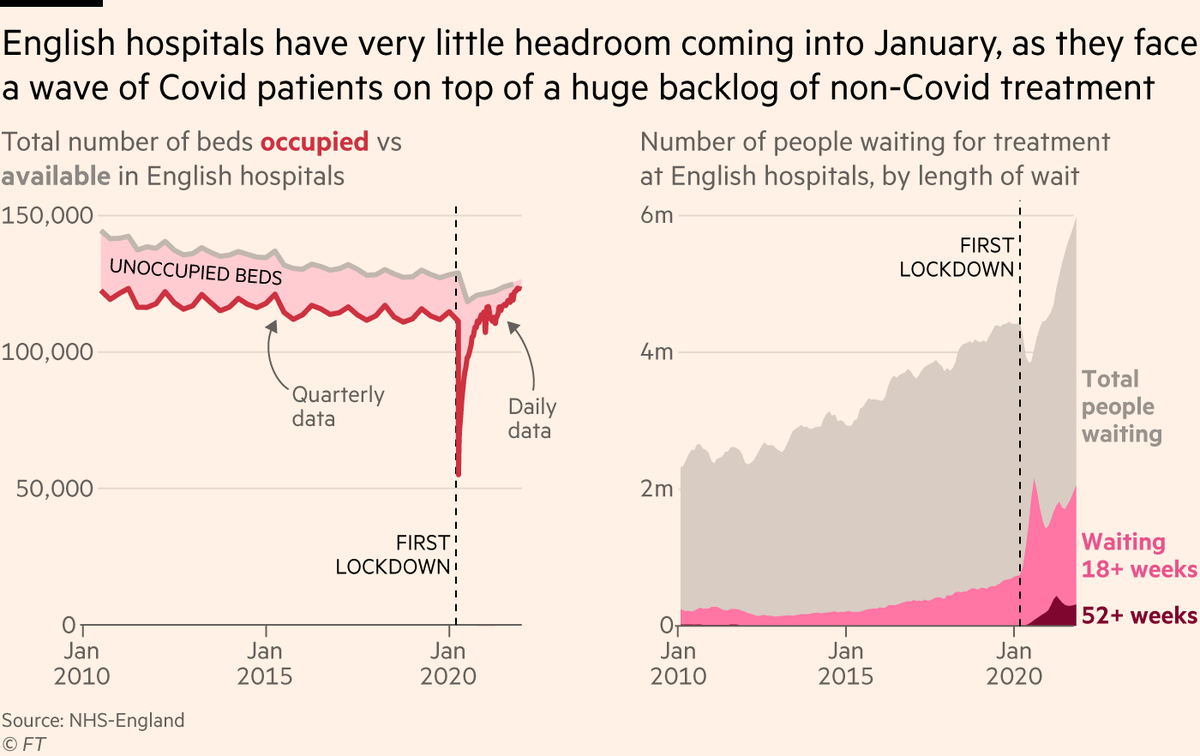
The dual factors of surging demand and diminished supply would be a problem at any time, but this winter they come against a very different backdrop to past UK waves...
During the first two big waves, hospitals scaled down the amount of non-Covid treatment to create capacity.
This winter they’re trying to work through the resulting backlog of often very ill people waiting for treatment, and the result is far less headroom, far more stress.
This winter they’re trying to work through the resulting backlog of often very ill people waiting for treatment, and the result is far less headroom, far more stress.
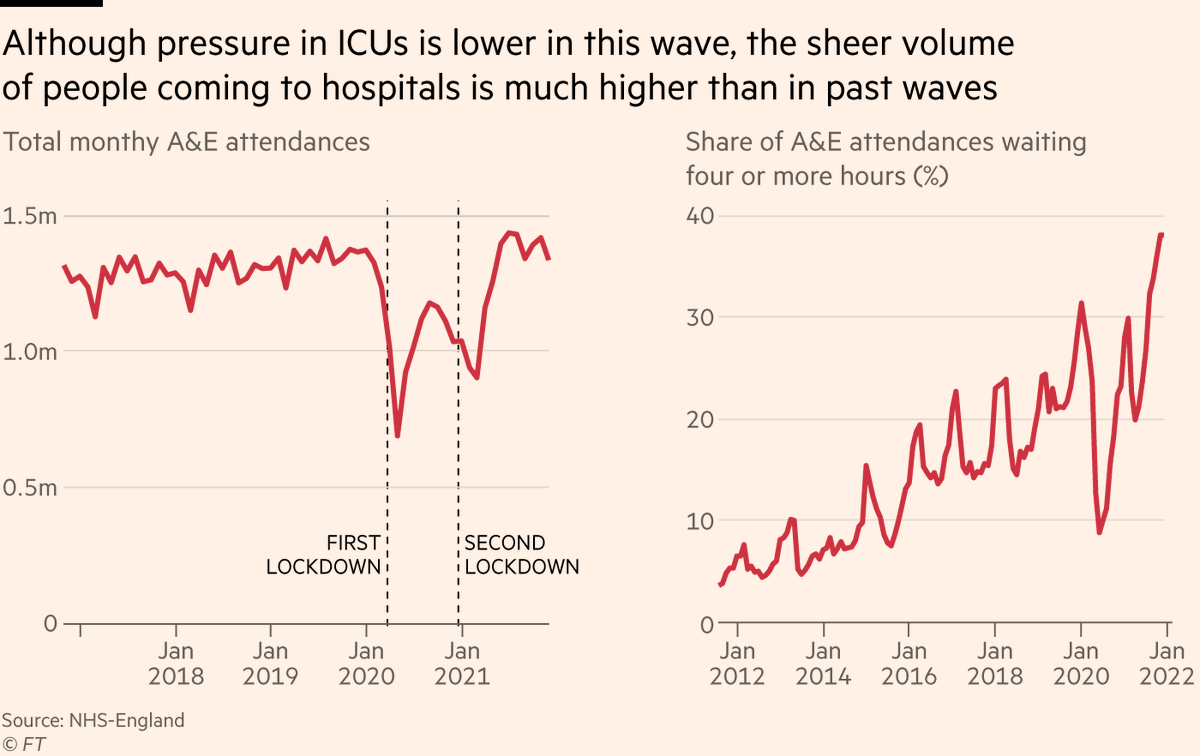
Another recurring point made by those on the front lines is that the pressure on emergency departments is immense.
Data from London is stark: last year A&E attendances plummeted as many people avoided hospitals. This year Covid comes on top of very high winter A&E pressures.
Data from London is stark: last year A&E attendances plummeted as many people avoided hospitals. This year Covid comes on top of very high winter A&E pressures.
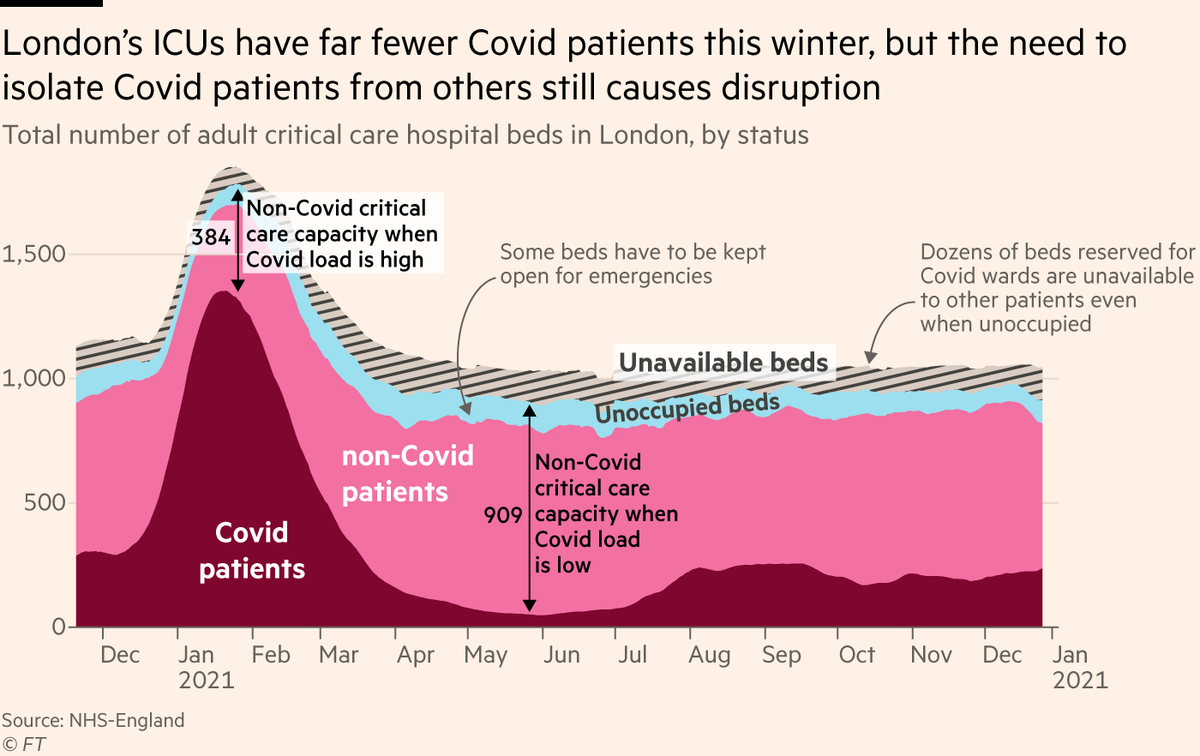
And even though London’s ICUs have far fewer Covid patients this winter, there is still significant disruption:
The need to keep patients with Covid away from those without means there is less capacity for non-Covid care this winter than there would otherwise be.
The need to keep patients with Covid away from those without means there is less capacity for non-Covid care this winter than there would otherwise be.
Overall the picture is clear:
While ICU is under less pressure from Covid this year, the rest of the hospital is facing more.
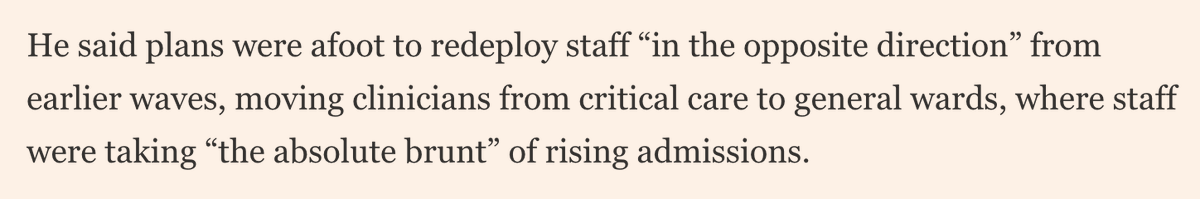
One critical care consultant told us they may end up having to redeploy staff from ICUs to other wards.
Not so much less pressure as different pressure
While ICU is under less pressure from Covid this year, the rest of the hospital is facing more.
One critical care consultant told us they may end up having to redeploy staff from ICUs to other wards.
Not so much less pressure as different pressure
Here’s the same story from the US. Less load on ICUs, but immense pressure elsewhere.
What we’re seeing is the real-world manifestation of what many have said for weeks: reduced severity is great news, but pressure is a function of both severity & volume
What we’re seeing is the real-world manifestation of what many have said for weeks: reduced severity is great news, but pressure is a function of both severity & volume
https://twitter.com/kit_delgadoMD/status/1477846774899519497
I hope people can now appreciate why the current situation is so hard to condense into a simple takeaway.
Yes, a much lower share of cases are developing severe disease. Yes, deaths for this wave will remain well below past peaks.
But no, this does not mean everything is fine.
Yes, a much lower share of cases are developing severe disease. Yes, deaths for this wave will remain well below past peaks.
But no, this does not mean everything is fine.
Anyway, I promised international comparisons, and here we are:
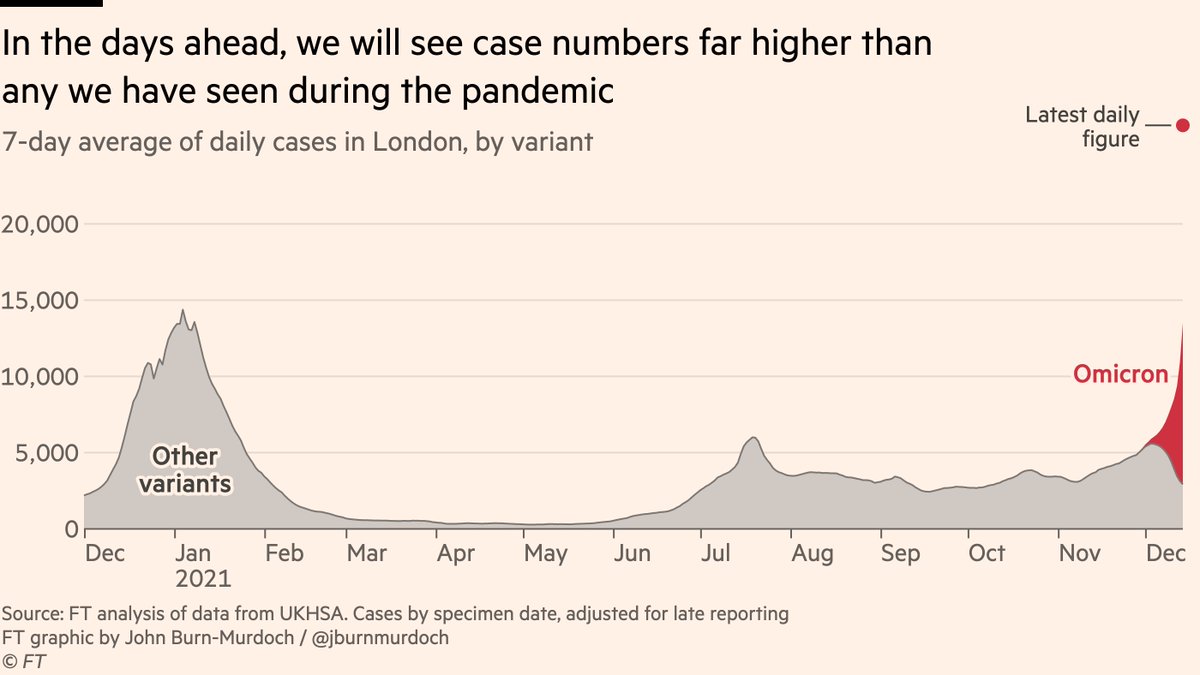
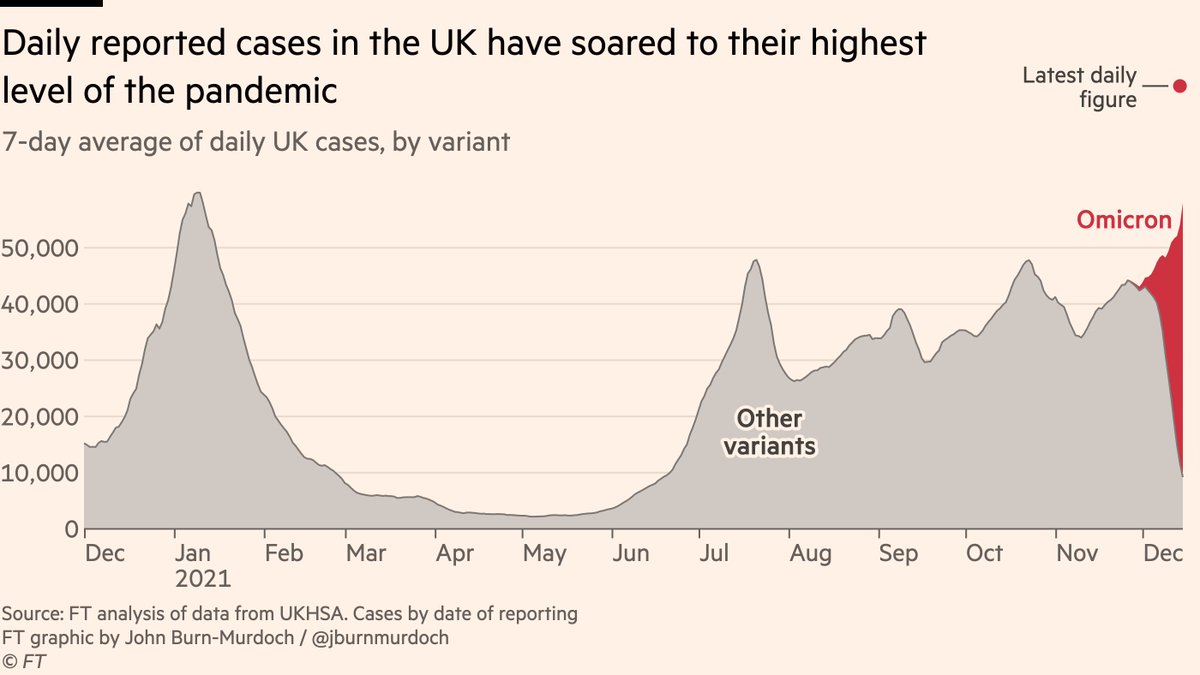
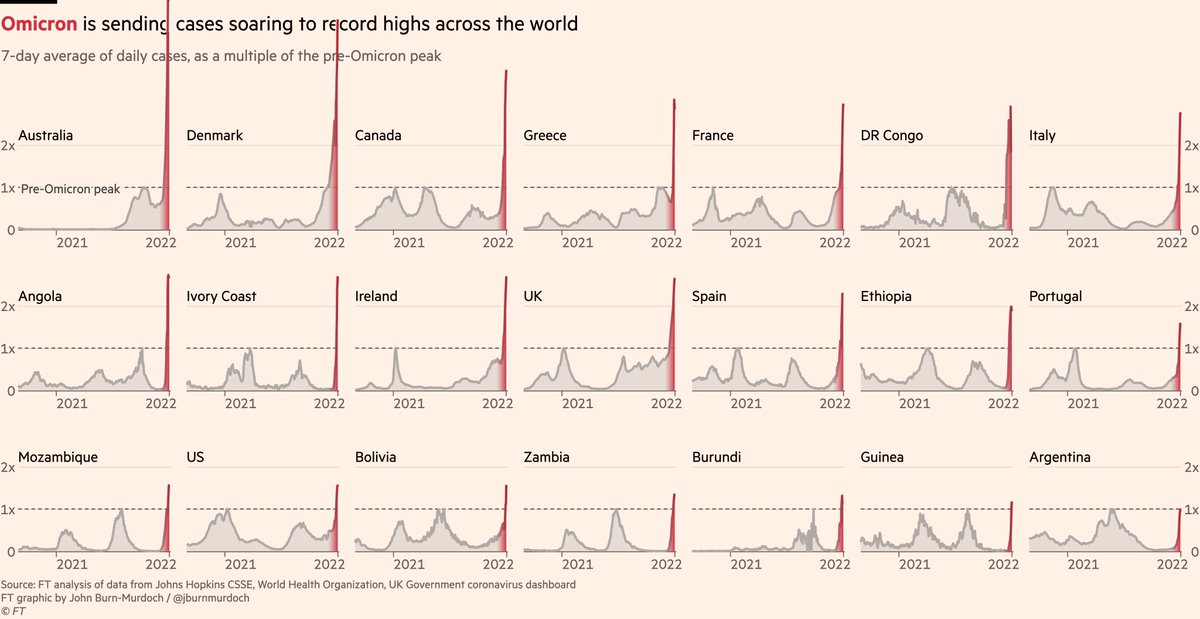
Omicron has now sent cases soaring to record highs in more than 20 countries globally, from Africa to Europe to Australia to the Americas.
Omicron has now sent cases soaring to record highs in more than 20 countries globally, from Africa to Europe to Australia to the Americas.
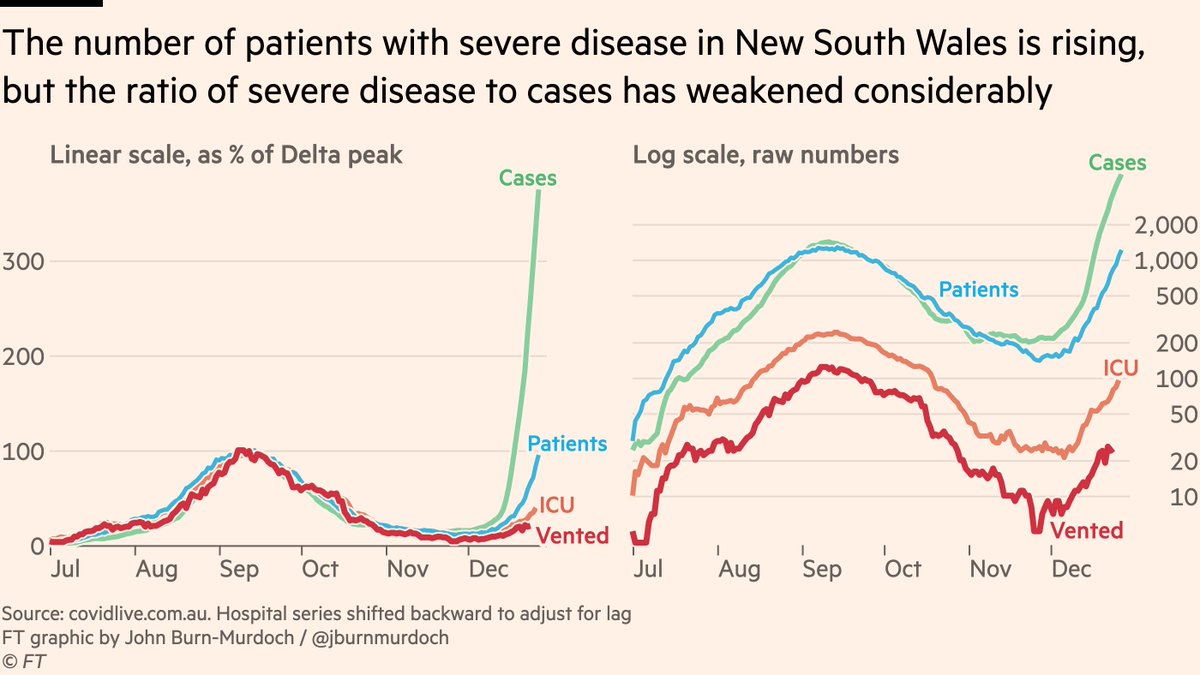
Let’s look at the severity picture in some of those countries, starting with Australia, where the Omicron wave in New South Wales is at a similar stage to London.
NSW is a great case study in how different presentations of the same data can paint very different pictures...
NSW is a great case study in how different presentations of the same data can paint very different pictures...
On the left, @edjegasothy’s approach shows the link between cases and acute outcomes has weakened considerably: good news
On the right, @OYCar’s preferred chart shows ICU and vent numbers are following cases upwards: bad news
Both show the same data. Both show reduced severity.
On the right, @OYCar’s preferred chart shows ICU and vent numbers are following cases upwards: bad news
Both show the same data. Both show reduced severity.
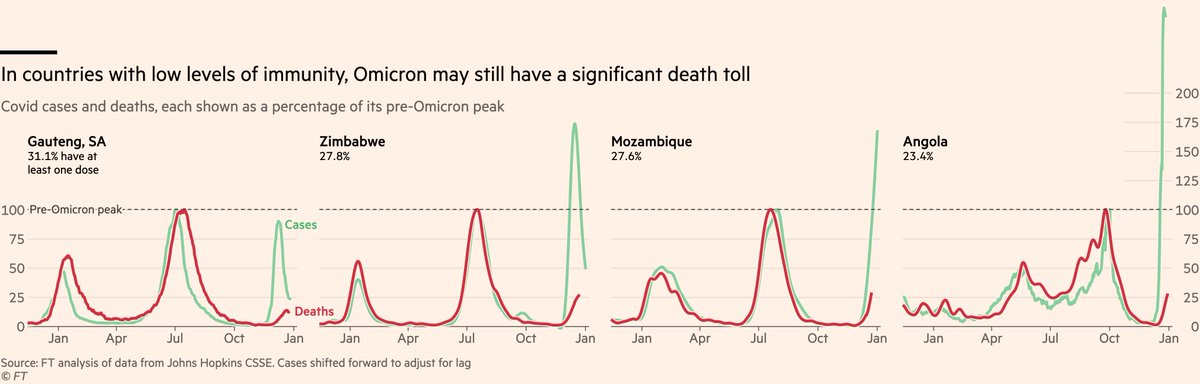
The most important thing we should take away from international comparisons, though, is that Omicron will play out differently from one country to the next, and even though it will be "less severe" everywhere, this can still mean it’s much more severe in some places than others.
The best illustration of this is Africa, where Covid deaths have passed 25% of their Delta peak in Mozambique and Angola, and are still rising.
In wealthy, well-boosted countries like the UK, deaths this wave may peak at 10-15% of the previous record. In others they may hit 50%.
In wealthy, well-boosted countries like the UK, deaths this wave may peak at 10-15% of the previous record. In others they may hit 50%.
Sticking with immunity, there has been a lot of concern about Omicron hospitalisations in children, but it’s crucial to consider the role of immunity here:
Left: hospitalisations among kids are at record highs.
Right: but they remain at much lower risk than adults
Left: hospitalisations among kids are at record highs.
Right: but they remain at much lower risk than adults
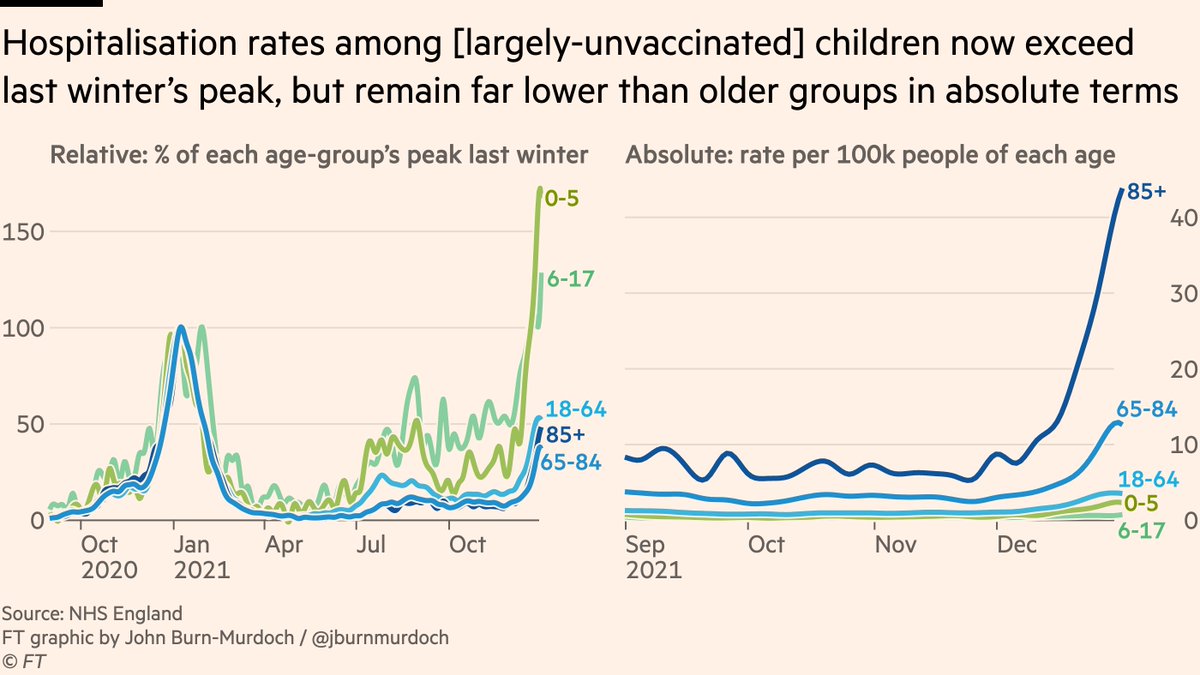
It’s not that Omicron is more severe for kids than past variants, it’s "adults now have loads of immunity, kids don’t, and hospitalisations will absolutely exceed past peaks among the unvaxxed, young or old"
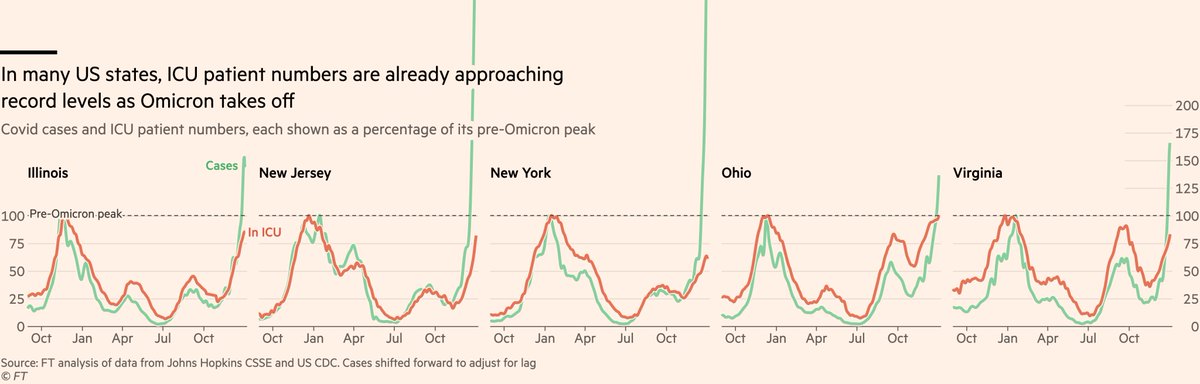
Another issue is the level of existing pressure Omicron arrives into. In the US, Omicron has landed right on top of a nasty winter Delta wave.
Covid ICU numbers are approaching record highs in several states, and even a less severe variant can push them over the top
Covid ICU numbers are approaching record highs in several states, and even a less severe variant can push them over the top
A critical variable in these international trajectories will be each population’s 'immunity wall' (HT @devansinha).
Here are the levels and types of immunity by age in England, US and Austria (HT @DNoisternig). Red = people who not been vaxxed or infected, and remain vulnerable
Here are the levels and types of immunity by age in England, US and Austria (HT @DNoisternig). Red = people who not been vaxxed or infected, and remain vulnerable
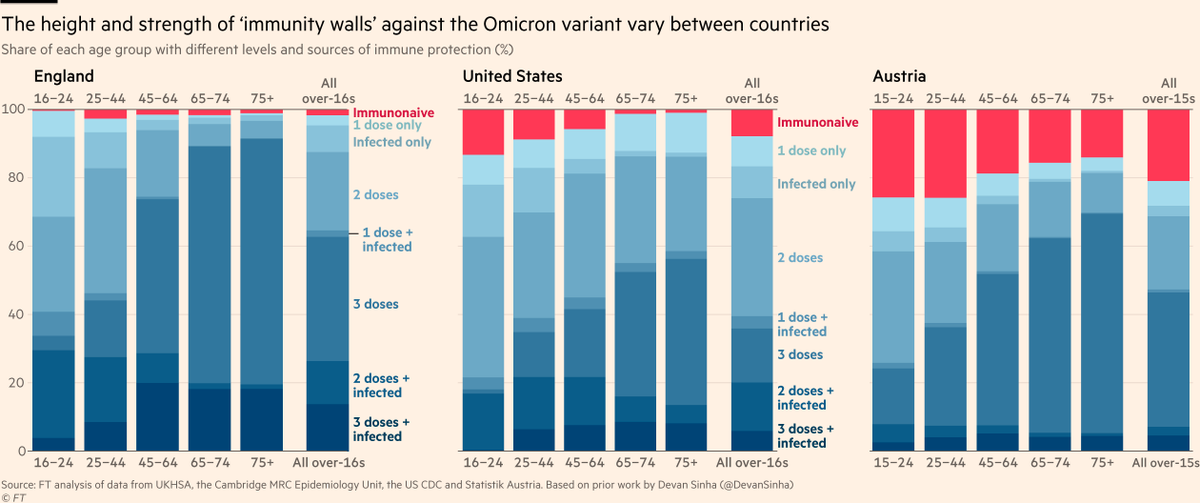
From country after country we’re hearing that the majority of cases ending up in ICU are unvaccinated. Even in countries like England where this group is now a vanishingly small share of the population
https://twitter.com/jim_reed/status/1477421130533249028
With a variant that spreads so far and so fast, the Omicron wave more than any other will be exceptionally good at seeking out the last few unprotected people, so even a small difference in the immunonaive share of the population could make a big difference to ICU pressure

Indeed, a significant portion of the divergence between cases and severe outcomes in England may come from its potent mix of high past infection rates and a rapid booster rollout. It has never been more important for all countries to get vaccines into arms
That’s more than enough for now.
Key points:
1) With Omicron, share of cases going to ICU, ventilator or death will be lower than in past waves. Partly intrinsic, partly immunity
2) But sheer volume of people going to hospital with Omicron will cause intense hospital pressure
Key points:
1) With Omicron, share of cases going to ICU, ventilator or death will be lower than in past waves. Partly intrinsic, partly immunity
2) But sheer volume of people going to hospital with Omicron will cause intense hospital pressure
3) So rather than thinking "only for-Covid patients or vented/ICU matter, ignore with-Covid", a better framework is "for-Covid and vented/ICU indicate the toll this wave will take on lives. With-Covid numbers indicate the toll on the health service"
4) This will play out differently in different countries depending on the level of existing hospital pressure Omi arrives into
5) Part of why we see more mild cases now is immunity — the unvaxxed continue to make up majority of ICU cases. Get boostered (or get primary vaxxed!)
5) Part of why we see more mild cases now is immunity — the unvaxxed continue to make up majority of ICU cases. Get boostered (or get primary vaxxed!)
Other excellent threads worth reading:
• @TheFerrariLab on the strengths and weaknesses of different metrics during this wave, and the nuances of hospital cases with Omicron
• @TheFerrariLab on the strengths and weaknesses of different metrics during this wave, and the nuances of hospital cases with Omicron
https://twitter.com/TheFerrariLab/status/1477666228554633226
• @kit_delgadoMD’s full thread on the hospital situation in Philadelphia. Brilliant breakdown of different types of cases now presenting, and what to take away from all of this
https://twitter.com/kit_delgadoMD/status/1477839370019295233
• The latest of @ChrisCEOHopson’s invaluable threads on the situation facing the NHS. Data can only tell us so much, especially in a wave like this where nuance is taking a front seat. Chris’s threads are a must-read for anyone following the UK situation
https://twitter.com/ChrisCEOHopson/status/1477941212648808451
• A characteristically excellent analysis from @nicfreeman1209 looking at the extent to which the cases -> hospitalisations link is weakening in different age-groups in London
https://twitter.com/nicfreeman1209/status/1477688230057332737
And for the approximately three of you who have read this far, as always please leave feedback, questions, criticism etc. I hope I’ve not missed anything important here, but please let me know if I have 🙏
As ever, a huge thanks to everyone who talked me through the complexities of the current situation for this thread and gave pointers on datasets, including @ChrisCEOHopson and front line hospital workers from the UK, Canada and Australia (especially @anna_bm37)
• • •
Missing some Tweet in this thread? You can try to
force a refresh