How to successfully catch a reversal and points to look for ( A thread🧵)
Like & Re-tweet for wider reach
So unlike buying a breakout, catching a reversal is quite tricky and more risky because a stock is already in a downtrend, it's like catching a falling knife.
Continued...
Like & Re-tweet for wider reach
So unlike buying a breakout, catching a reversal is quite tricky and more risky because a stock is already in a downtrend, it's like catching a falling knife.
Continued...
But if done properly, can be quite rewarding.
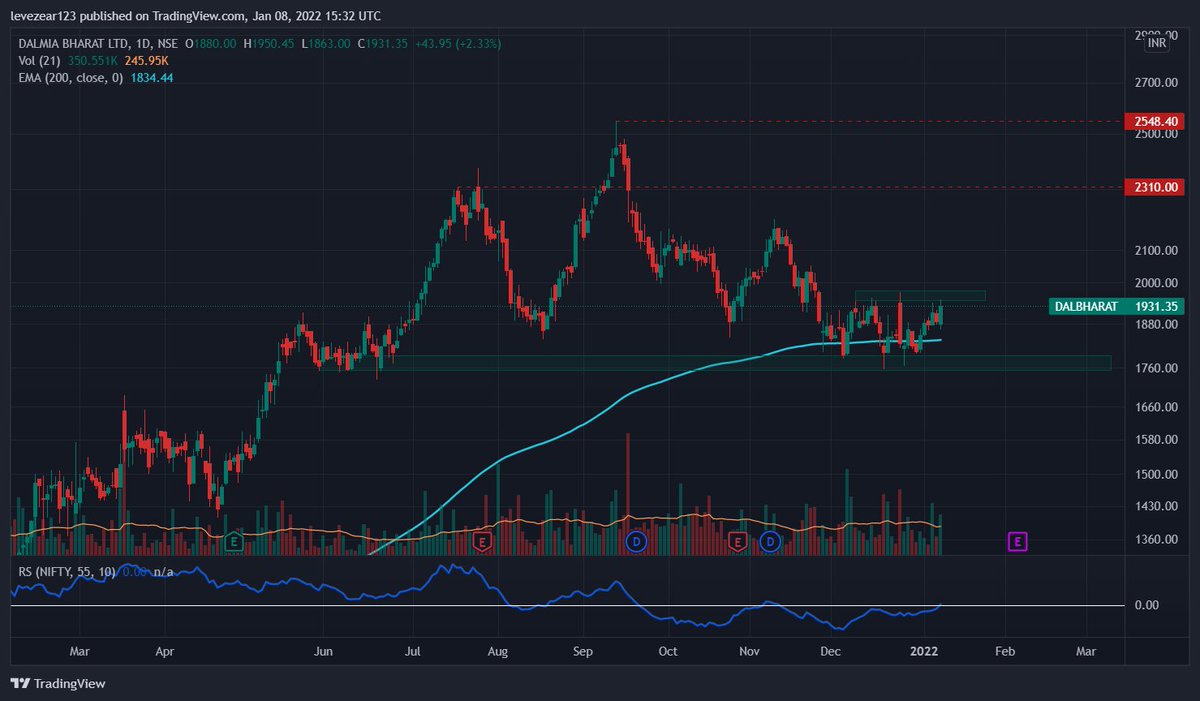
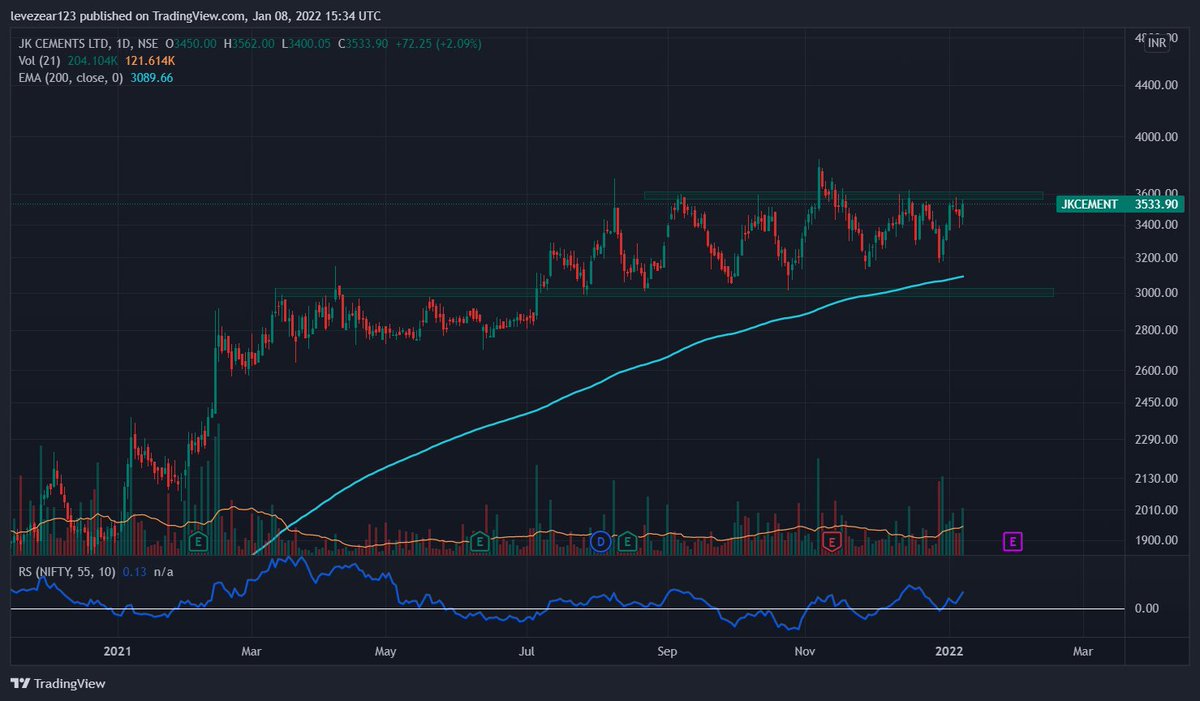
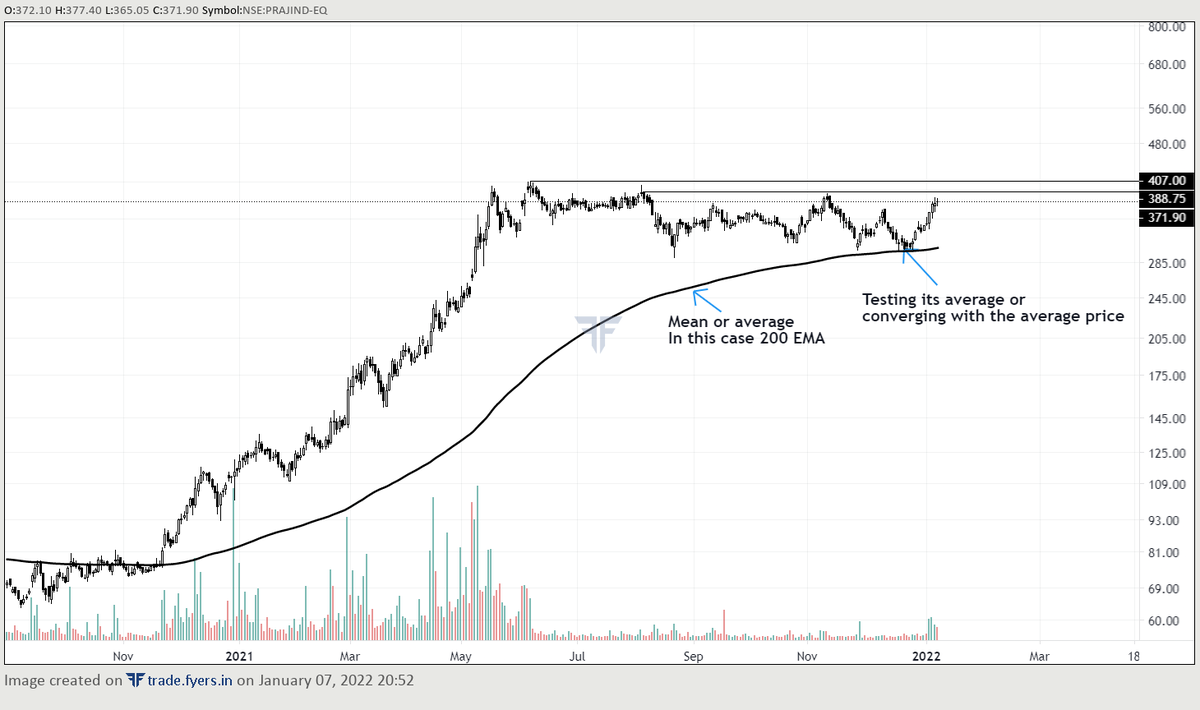
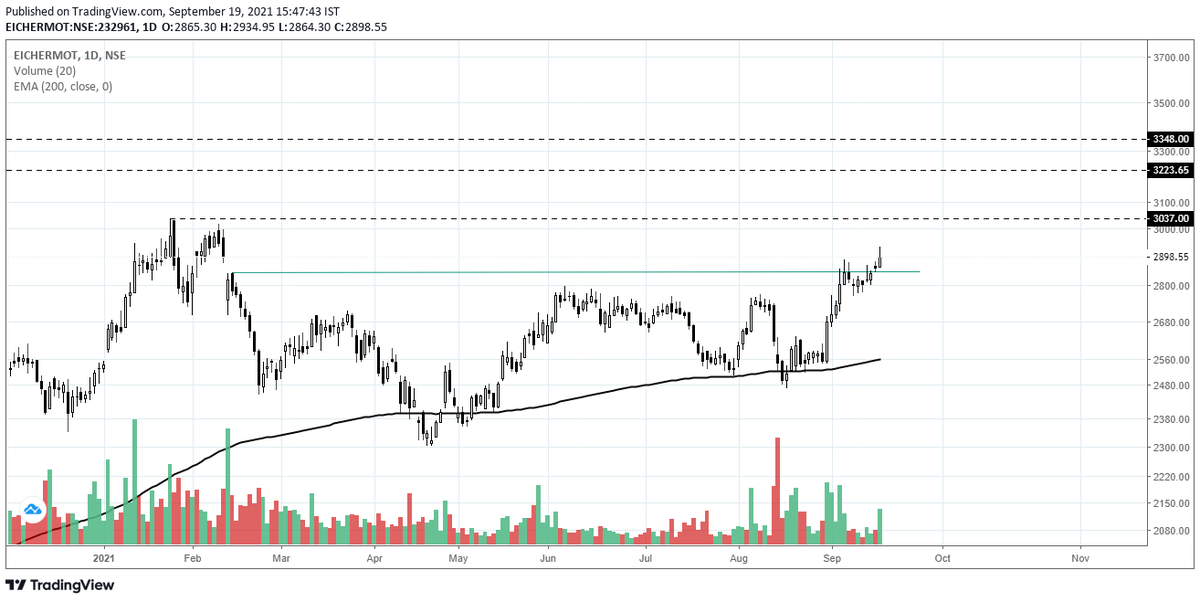
The 1st basic and one of the most important tool you can use is good old 200 Day moving average.
So 1st of all, look for stocks approaching their 200 Day MA.
The 1st basic and one of the most important tool you can use is good old 200 Day moving average.
So 1st of all, look for stocks approaching their 200 Day MA.
2nd thing, look for most obvious area that could act as a support, like - previous breakout region, previous consolidation, Fib retracement or moving average
Anything that looks like obvious support zone.
Anything that looks like obvious support zone.
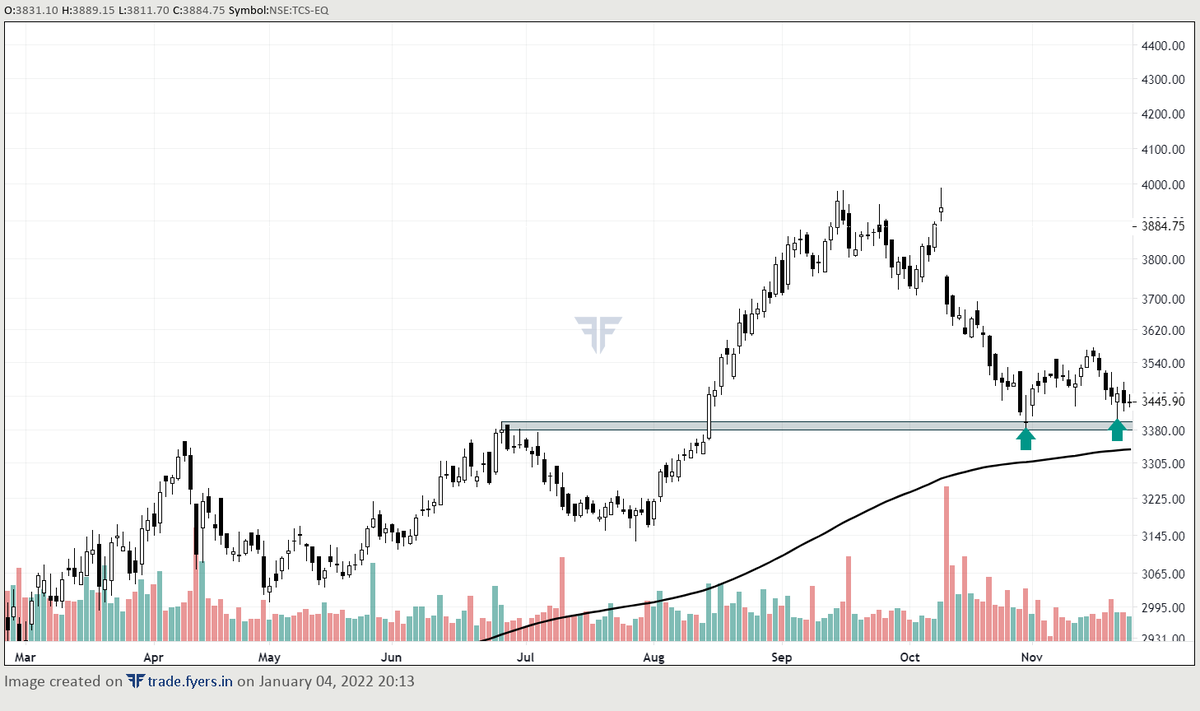
Here's an example - This is the chart of TCS before the current up move, 1 thing is pretty obvious, stock is approaching the 200 MA. 
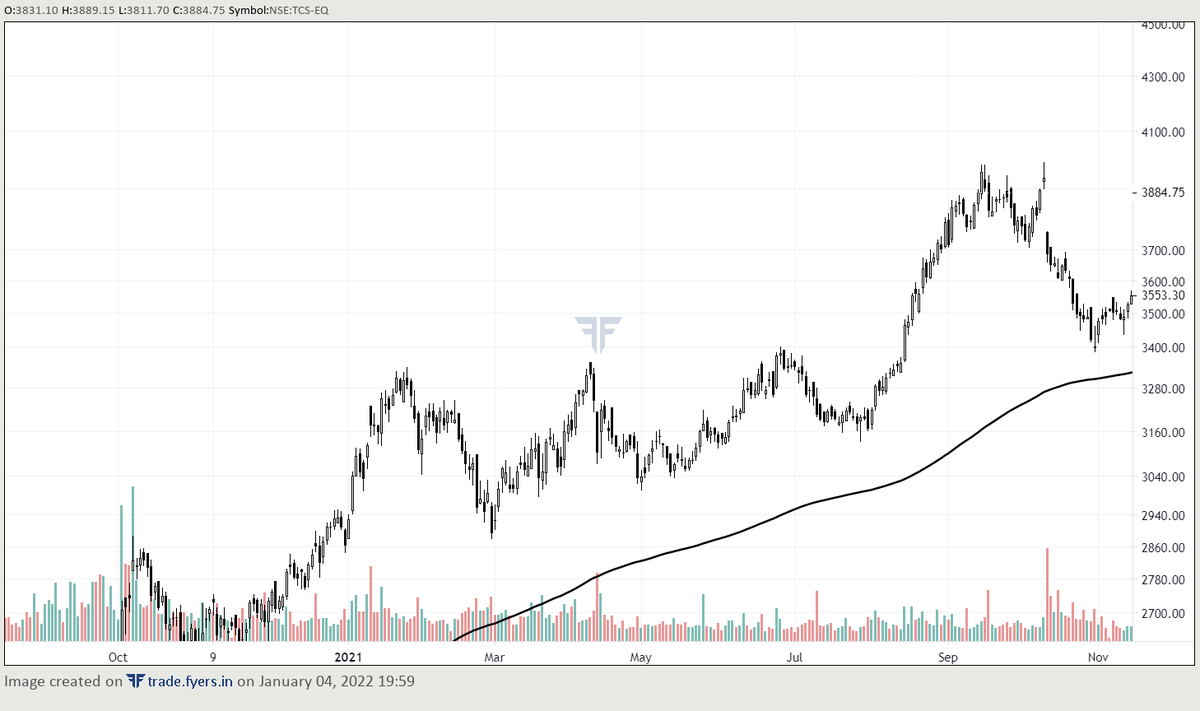
Now take a look at the zone that i've market, previous breakout zone✅
Now let's go little deeper, now focus on the volume and size of candle.
Volume should be decreasing on down days and candle shoulder be smaller in size with long lower wick.
Now let's go little deeper, now focus on the volume and size of candle.
Volume should be decreasing on down days and candle shoulder be smaller in size with long lower wick.
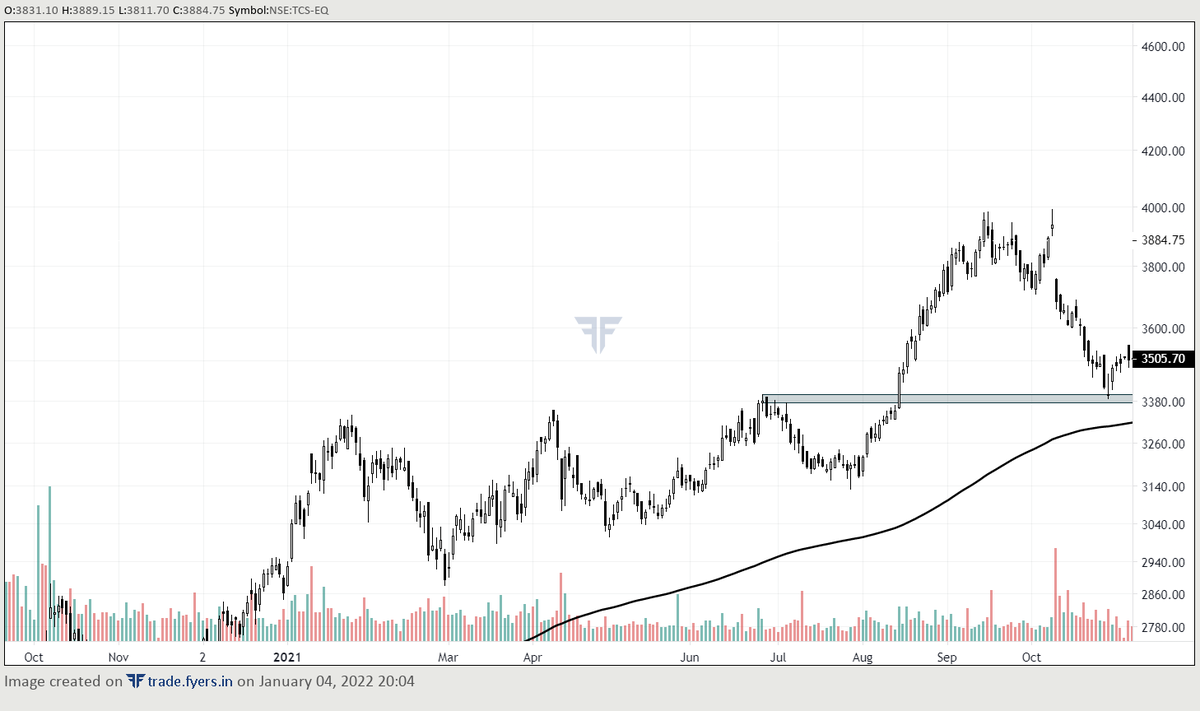
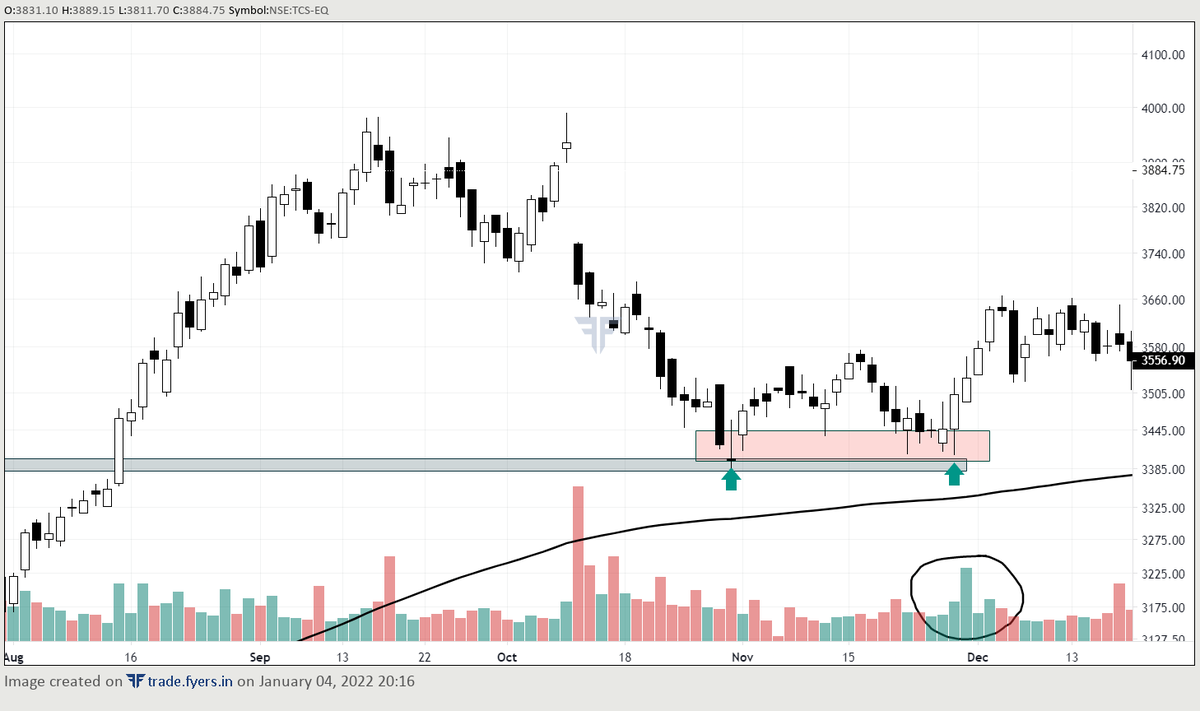
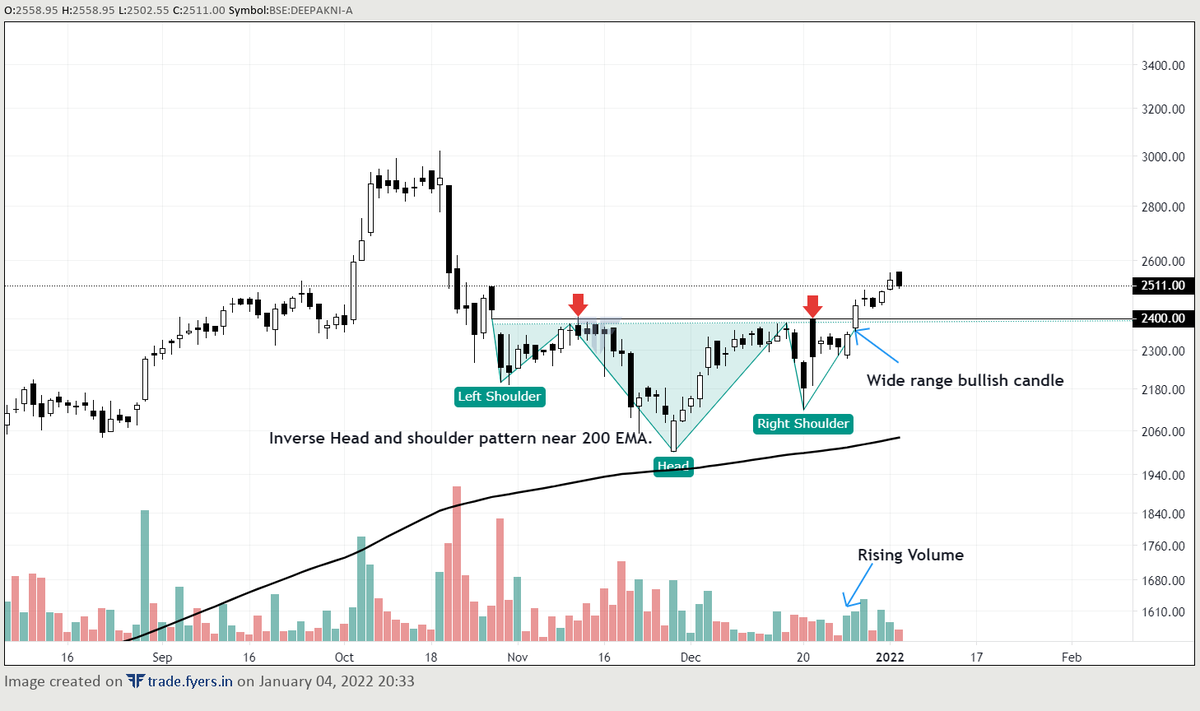
Now wait and observe the price action around the support zone, look for reversal patterns like double bottom, triple bottom, rectangle, descending triangle etc.
Now in our example of TCS, the stock bounced back from the support zone and started rising ( Positive sign)
But again started coming down. Now again wait and price the price action at support zone.
Like in this case, look at 2nd arrow, long lower wick ( positive sign)
But again started coming down. Now again wait and price the price action at support zone.
Like in this case, look at 2nd arrow, long lower wick ( positive sign)
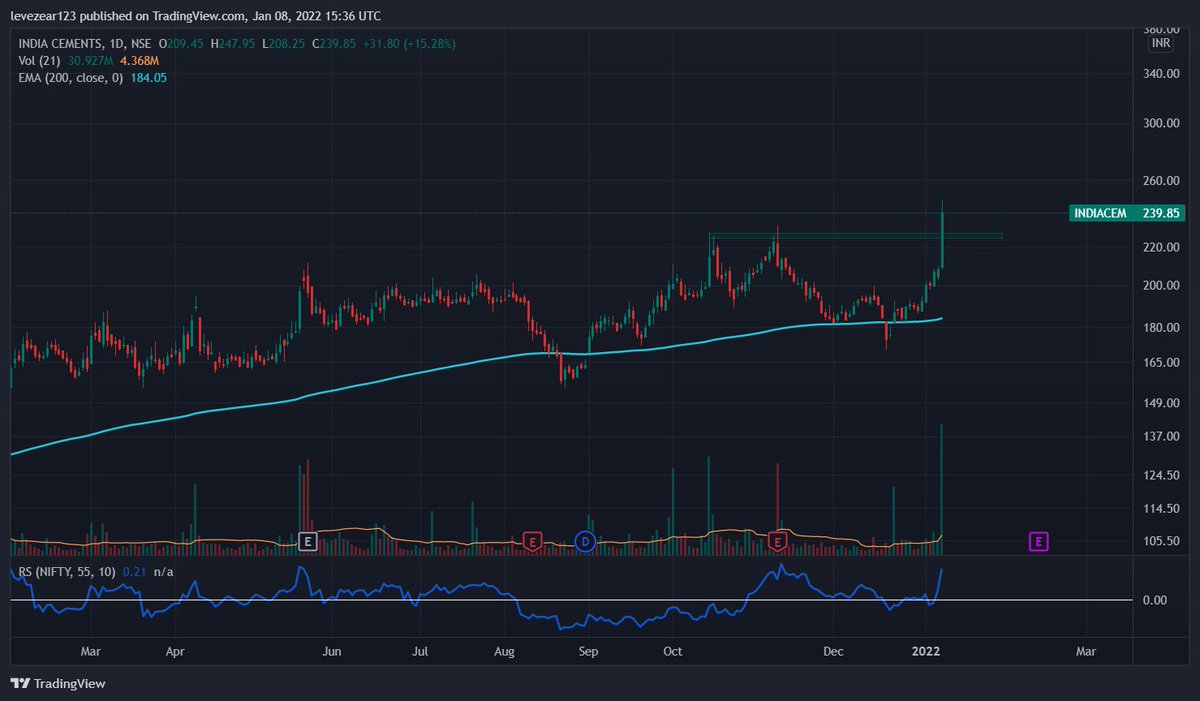
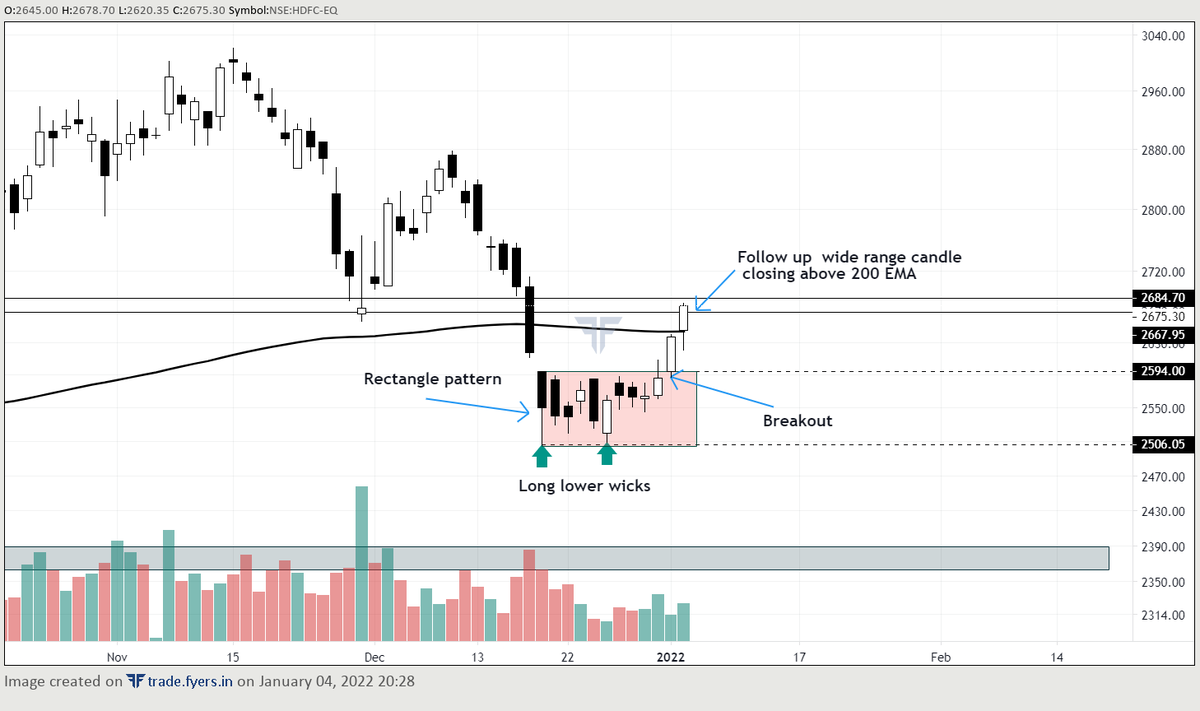
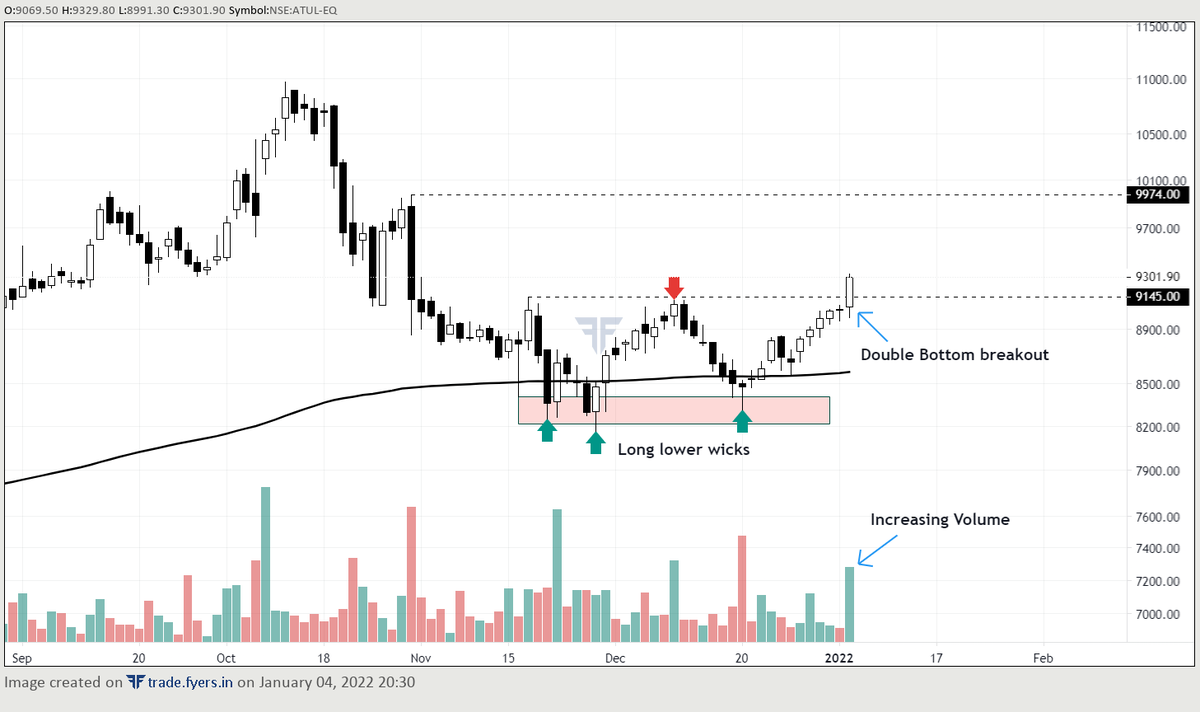
Now focus on candle in the red zone. Most of the have long lower wicks (Which is a good sign), and take a look at the volumes, rising with the price ( Another good sign).
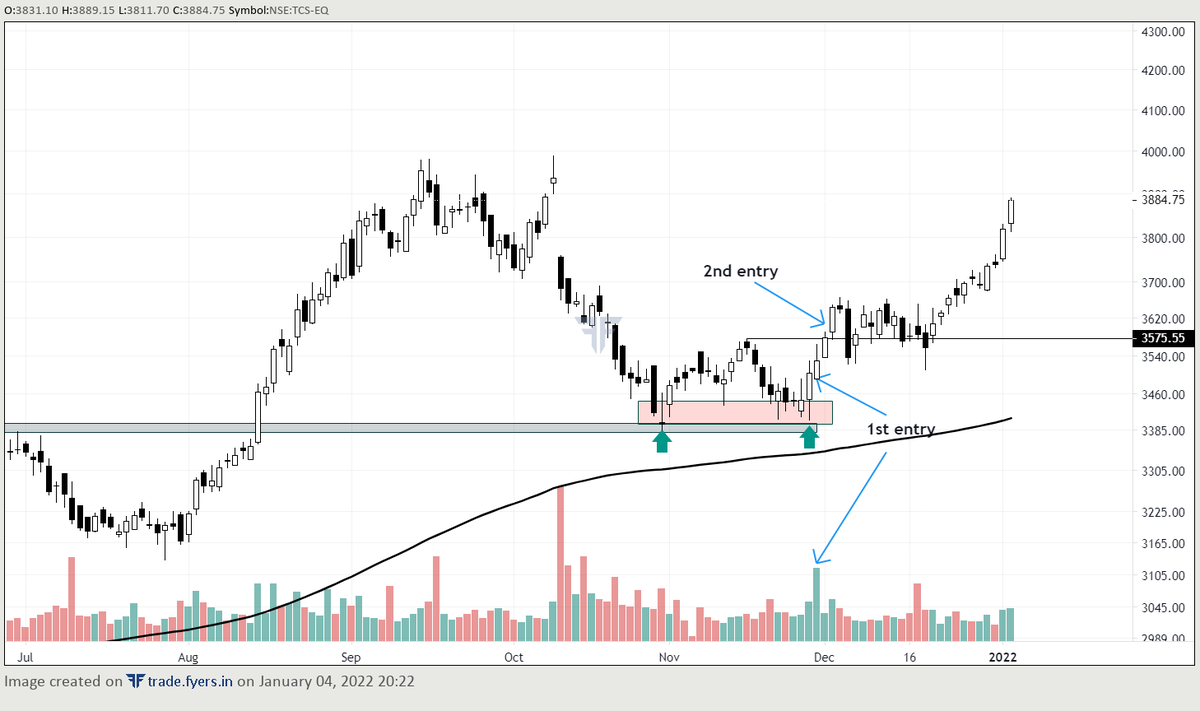
Now the question remains, When one should take entry?
Well in such cases, 25% when you see follow up rising candle with good volume, and rest when the stock breaks the 1st resistance.
Well in such cases, 25% when you see follow up rising candle with good volume, and rest when the stock breaks the 1st resistance.
In theory it looks easy but it is very difficult to apply real time.
But with enough practice, you'll started identifying the difference between a proper reversal or a fake one subconsciously.
But with enough practice, you'll started identifying the difference between a proper reversal or a fake one subconsciously.
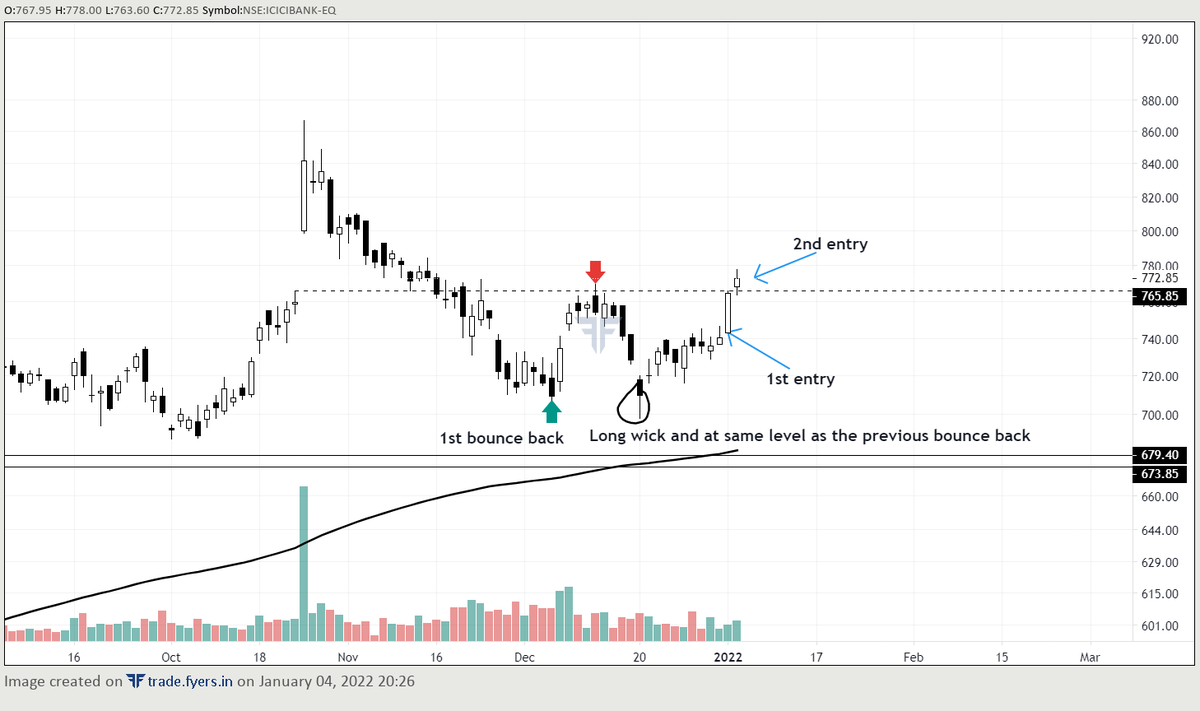
Here are few more examples of such reversals that i caught in real time -
ICICI BANK
ICICI BANK
HDFC -
ATUL -
Deepak Nitrite -
• • •
Missing some Tweet in this thread? You can try to
force a refresh