A Thread🧵on Mean Reversion and how it can help you in your trading journey.

Please like share & re-tweet for wider reach.

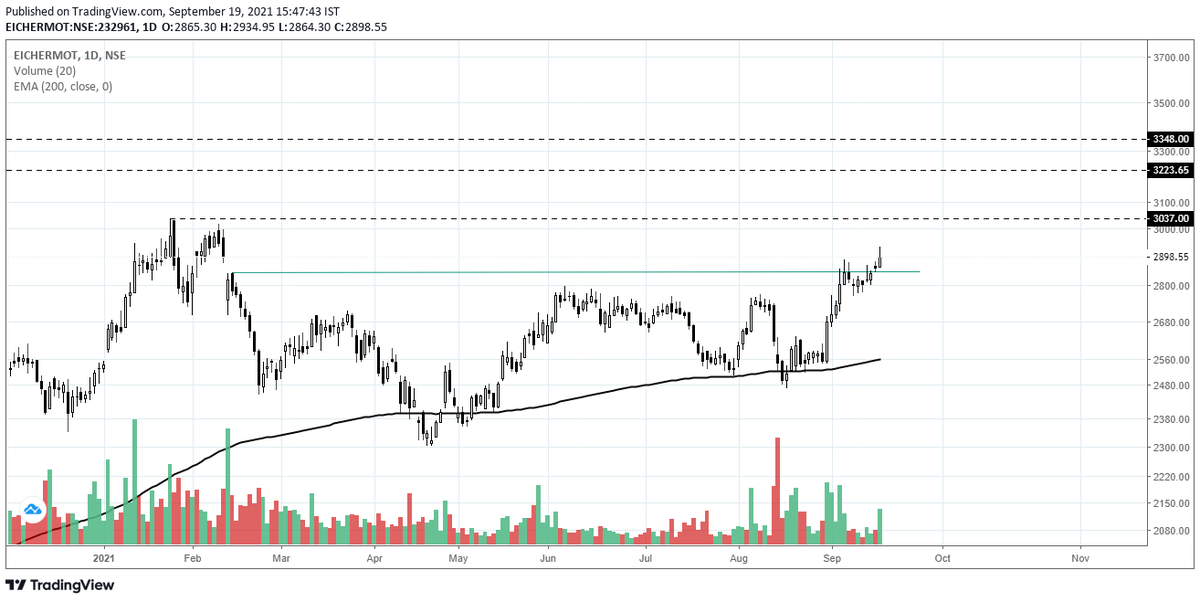
So Mean Reversion basically means when the price of the asset tend to converge to the average price over time.

Continued....
Here the asset could be anything like - Nifty, gold, bonds, any stock etc.

And the average could be anything like 20, 50, 200 day moving average.
So what happens is, price tends to test its average after spend fair amount of time away from it.
Let's try to understand it with an example.
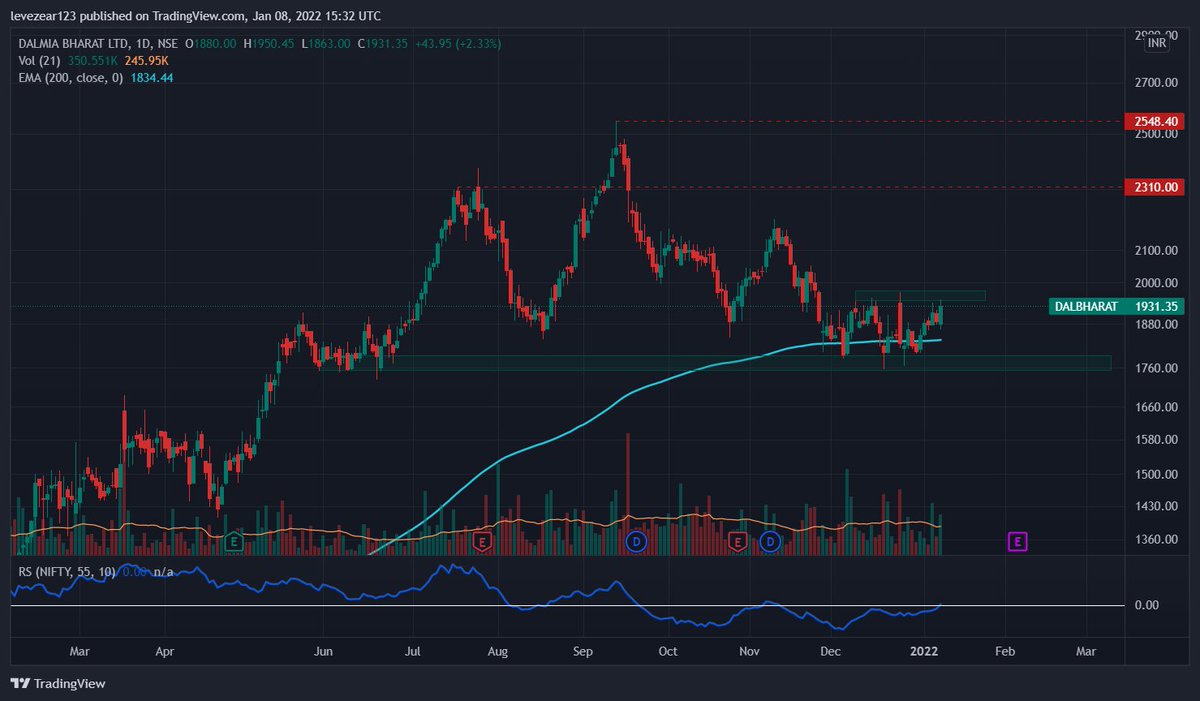
So as you can see in this example, the price deviated very far from it's 200 DEMA, but at one point started consolidating and waited till the average caught up. Image
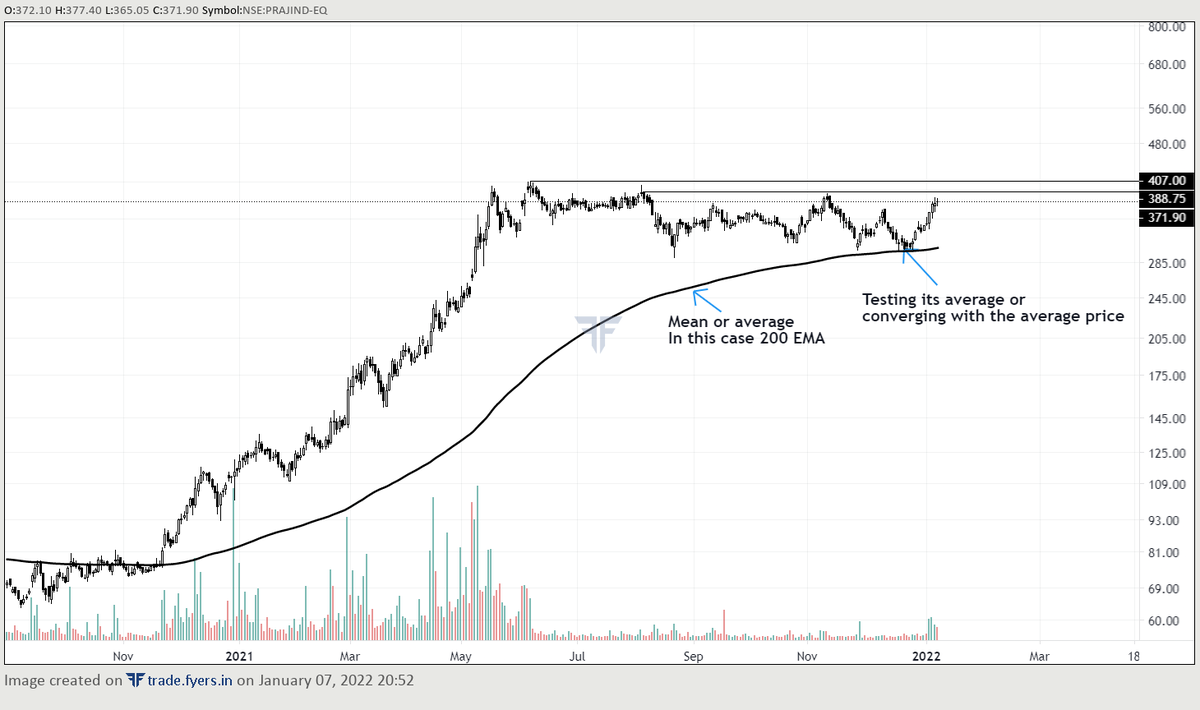
Mean reversion doesn't necessarily mean that the price will fall back to it's moving average.
It can just simply consolidate in a range till the average catch up.
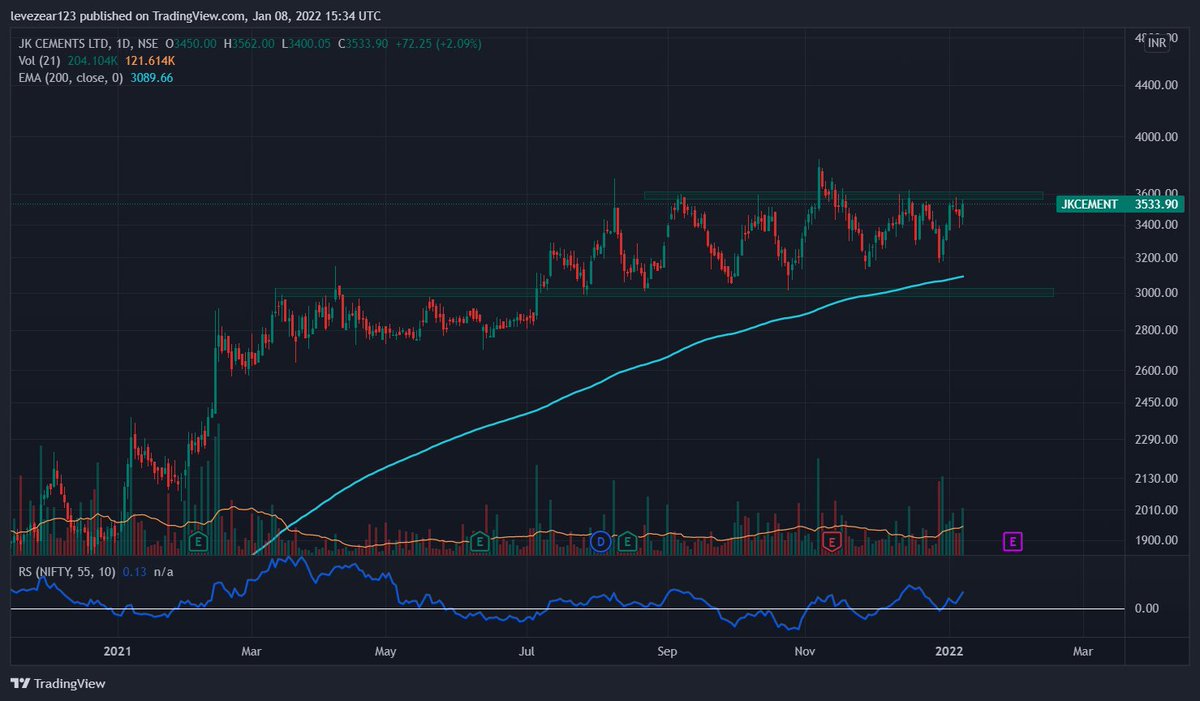
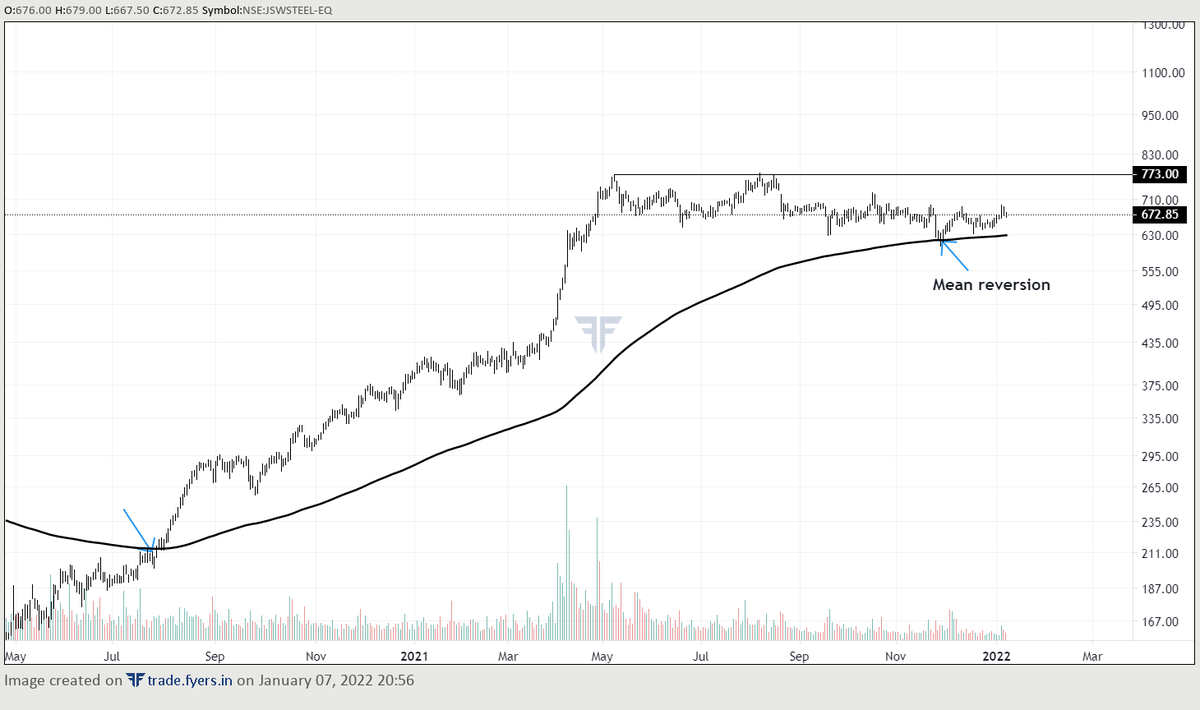
As in this case, after the initial testing its 200 DEMA back in august 2020, the price shot up very quickly away from it's 200 DEMA.
Then what happened?
Price started consolidating in a range till its 200 DEMA caught up. Image
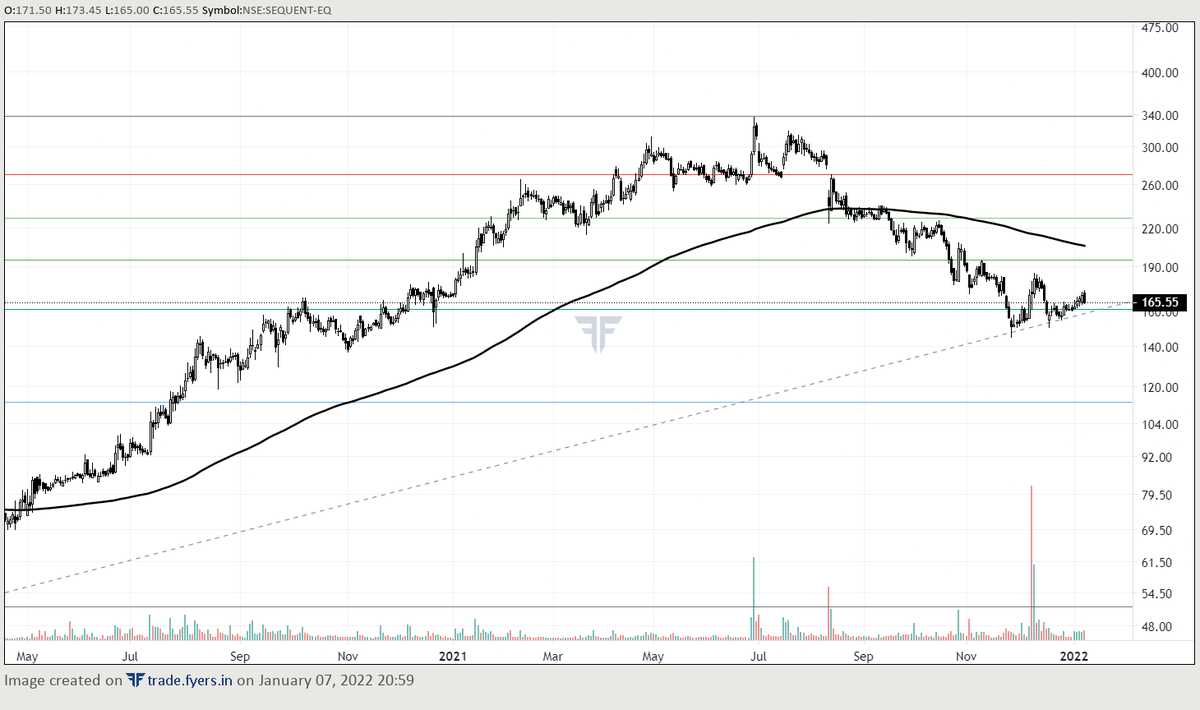
On the other hand, price can directly just fall down to the mean, just like what happened in the case of SEQUENT Image
So how can you really use it to improve your trading?

It helps in determining when to book profits ( Or at least partial profits)

Like when you're trading using daily time frame and for let's for few months.
And the price has deviated too much ( 80 - 100%) from its 200 DEMA, its a good time to book partial profits because someday price will go back to the mean and you don't wanna be caught up in that.
You can even use it in case of swing trading, let's say you're trading from few days to few weeks prospective.
Using 21 DEMA is a good idea.
For example, as in this case of TCS whenever the price deviated 5-7% from it's 21 EMA, it came back to test it. Image
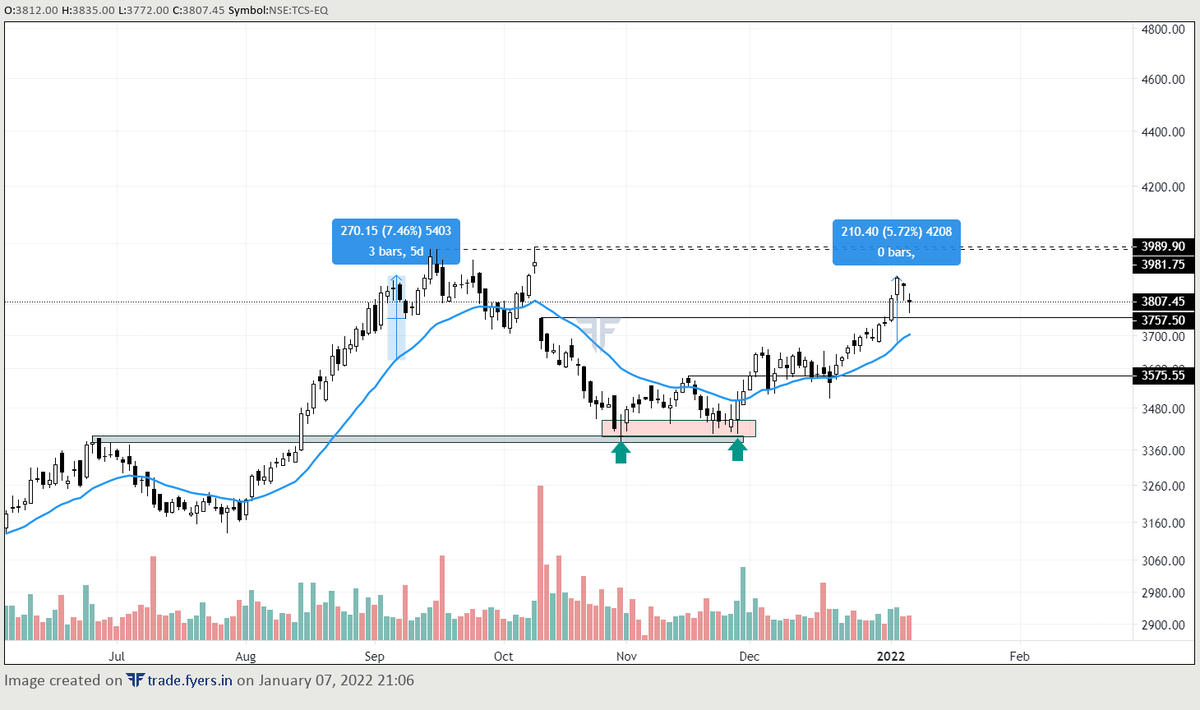
But this does not apply to every single stock because just like everybody has a different nature, every stock has different characteristics like average daily movement, high beta - low beta, some news or fundamental trigger than can help them to stay deviated for a long time.
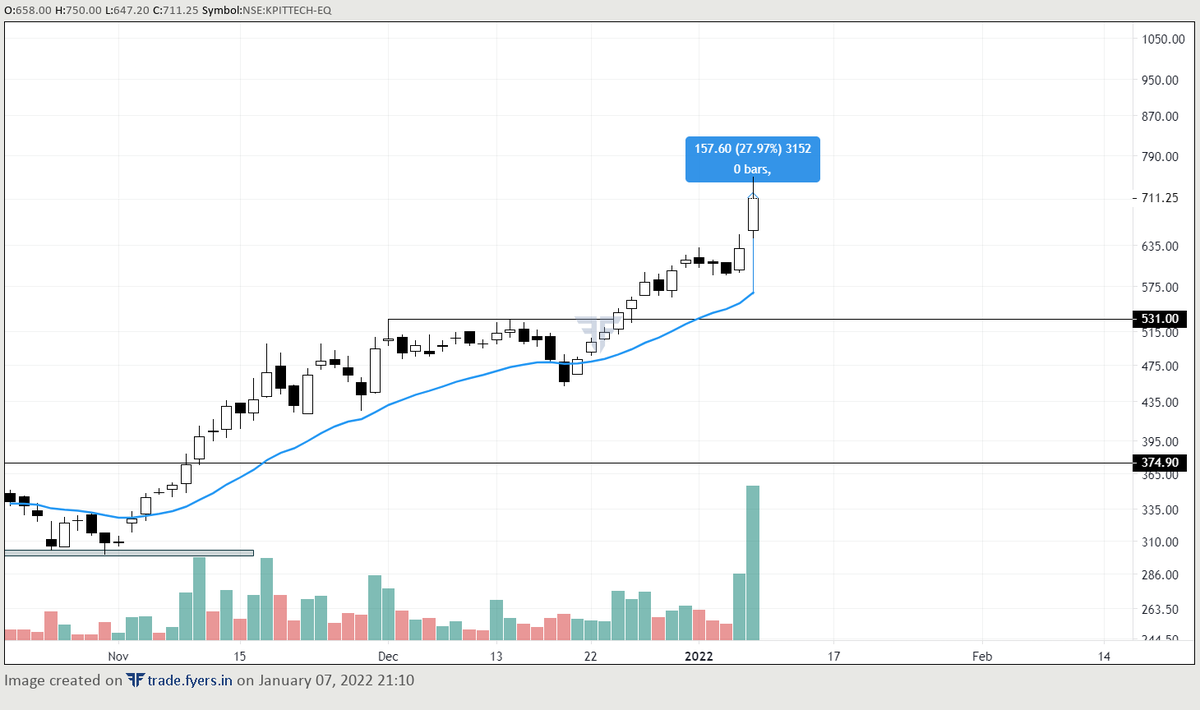
For example - In this case of KPIT TECH
price is 26% away from its 21 DEMA.
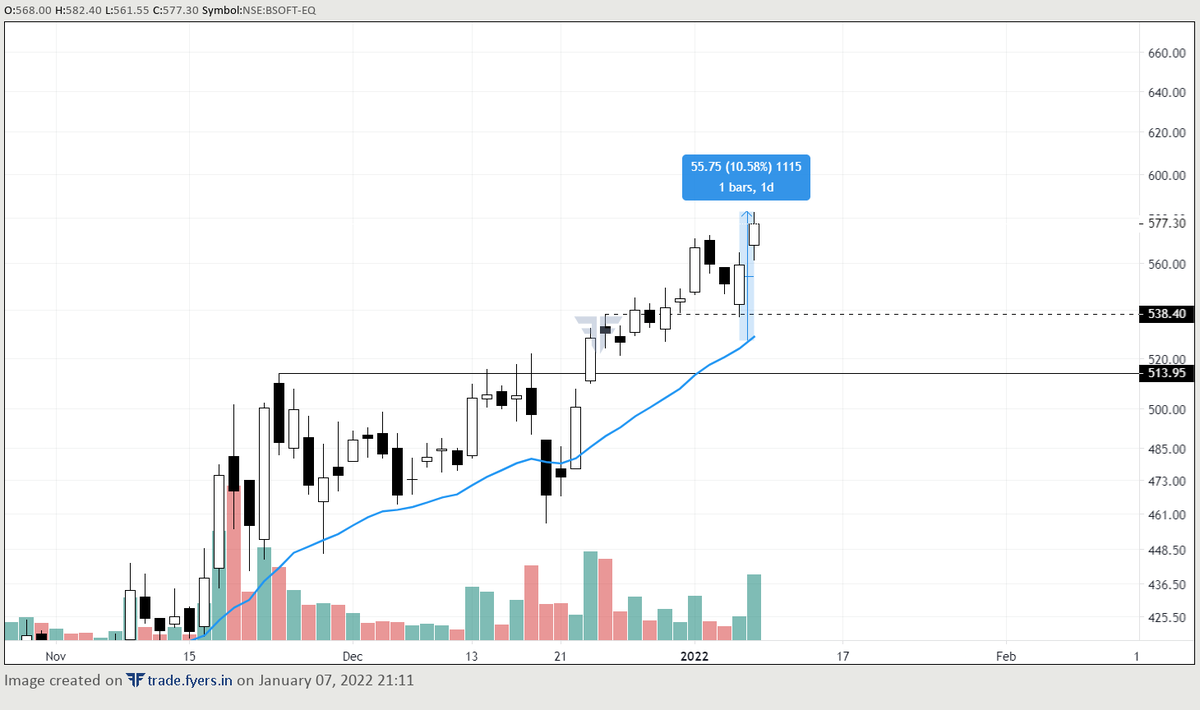
And in this case of BIRLASOFT, price is 10% away from 21 DEMA. ImageImage
So in the end trading is all about being flexible and trying what works best for you.

Hope you learned something, thanks for reading.

@shubhfin @charts_zone @suru27 @VVVStockAnalyst

• • •

Missing some Tweet in this thread? You can try to force a refresh
 

Keep Current with The Average Trader.

The Average Trader. Profile picture

Stay in touch and get notified when new unrolls are available from this author!

Read all threads

This Thread may be Removed Anytime!

PDF

Twitter may remove this content at anytime! Save it as PDF for later use!

Try unrolling a thread yourself!

how to unroll video
  1. Follow @ThreadReaderApp to mention us!

  2. From a Twitter thread mention us with a keyword "unroll"
@threadreaderapp unroll

Practice here first or read more on our help page!

More from @icanseeyourpix2

8 Jan
DALMIA BHARAT
Failed Head & Shoulder, now forming a rectangle right above the 200 EMA ready for reversal.
Breakout above 1960 Image
JK CEMENTS
One of the strong chart in cement sector.
just consolidating in a range while other stocks were falling, now near the upper boundary.

Need to cross 3600 for any upmove Image
INDIA CEMENTS
At new 52 W high, breakout with strong volume.
Any pullback could be used as a buying opportunity. Image
Read 5 tweets
4 Jan
How to successfully catch a reversal and points to look for ( A thread🧵)

Like & Re-tweet for wider reach

So unlike buying a breakout, catching a reversal is quite tricky and more risky because a stock is already in a downtrend, it's like catching a falling knife.

Continued...
But if done properly, can be quite rewarding.

The 1st basic and one of the most important tool you can use is good old 200 Day moving average.

So 1st of all, look for stocks approaching their 200 Day MA.
2nd thing, look for most obvious area that could act as a support, like - previous breakout region, previous consolidation, Fib retracement or moving average
Anything that looks like obvious support zone.
Read 14 tweets
1 Jan
A Thread (🧵) on India's Digital payments system and banking sector.

Let's start - India’s digital payments ecosystem has undergone a huge transformation with events like
demonetization and the COVID-19 pandemic necessitating a more efficient, user-friendly

1/n
and cost effective interface.

The RBI’s digital payment index (RBI – DPI) almost tripled to 271 in FY21 from the base year of
FY18.

The digital transactions value stood at Rs 147trn in FY21, of which large credit transfers is 72%
& Retail payments - 28%

2/n
In value terms, total payments grew at a
CAGR of 11% in FY12-20 but declined in FY21 due to the pandemic.

In volume terms total payments grew at a CAGR of 44.5% during FY19-21.

3/n
Read 25 tweets
24 Dec 21
HOW TO FIND STOCKS THAT ARE OUTPERFORMING THE MARKET ( A Thread🧵)

Please Share and Re-Tweet for wider reach

Its very hard to make money in current environment as most of the stocks are down 20-30% and Index itself is making Lower High and Lower Low.

Continued....
So we're gonna try to find stocks that are outperforming the market and will help us make some money using the concept of RELATIVE STRENGTH.

So what is Relative Strength?
Relative strength is a strategy used in momentum investing and in identifying value stocks.
It focuses on investing in stocks or other investments that have performed well relative to the market as a whole or to a relevant benchmark.

So basically in simple terms it means look for stocks that are moving in the opposite direction or not falling as compared to index.
Read 10 tweets
19 Sep 21
AUTO SECTOR TECHNICAL ANALYSIS

(Retweet for wider reach)

Let's start with analyzing #Niftyauto -

Gave H&S breakout but look support on 200 EMA and reversed. Need to cross right shoulder to confirm the reversal.

Now let's take a look at few auto sector companies charts.
Let's start with the one with the strongest chart - #BalkrishnaIndustries

Trading near ATH levels, when the whole nifty auto index was going down, it corrected only 10% and was the 1st one to recover.

A close above 2560 will take it to a target of 2776.
Next one we're gonna take a look at is - #eichermotors

Finally crossed the gap region (2850) that was acting as resistance. With good volume expansion.

If closes above 3037, can easily reach 3223 & 3348.
Read 8 tweets

Did Thread Reader help you today?

Support us! We are indie developers!


This site is made by just two indie developers on a laptop doing marketing, support and development! Read more about the story.

Become a Premium Member ($3/month or $30/year) and get exclusive features!

Become Premium

Too expensive? Make a small donation by buying us coffee ($5) or help with server cost ($10)

Donate via Paypal

Or Donate anonymously using crypto!

Ethereum

0xfe58350B80634f60Fa6Dc149a72b4DFbc17D341E copy

Bitcoin

3ATGMxNzCUFzxpMCHL5sWSt4DVtS8UqXpi copy

Thank you for your support!

Follow Us on Twitter!

:(