Today’s #COVID19 report in Minnesota showed a week-over-week drop in raw cases.

But if you’re not yet adjusting for testing volume, here in the year 2022, you may be beyond my help. The news is still bad; our average positivity rate shot up again, to 15%.
Today’s data are a little weird. We’ve got a big chunk of cases from last Thursday, before NYE, & then a big chunk of cases from the holiday weekend, when few people got tested but a lot of the ones who did were positive.

Again, never read too much into any one day’s report.
Newly reported cases fell overall today, due to lower testing volume, and @mnhealth only releases test totals/positivity rate by county on Thursdays for some reason, but w/ that, overall we’ve still got new cases in Hennepin/Ramsey higher than they’ve ever been all pandemic.
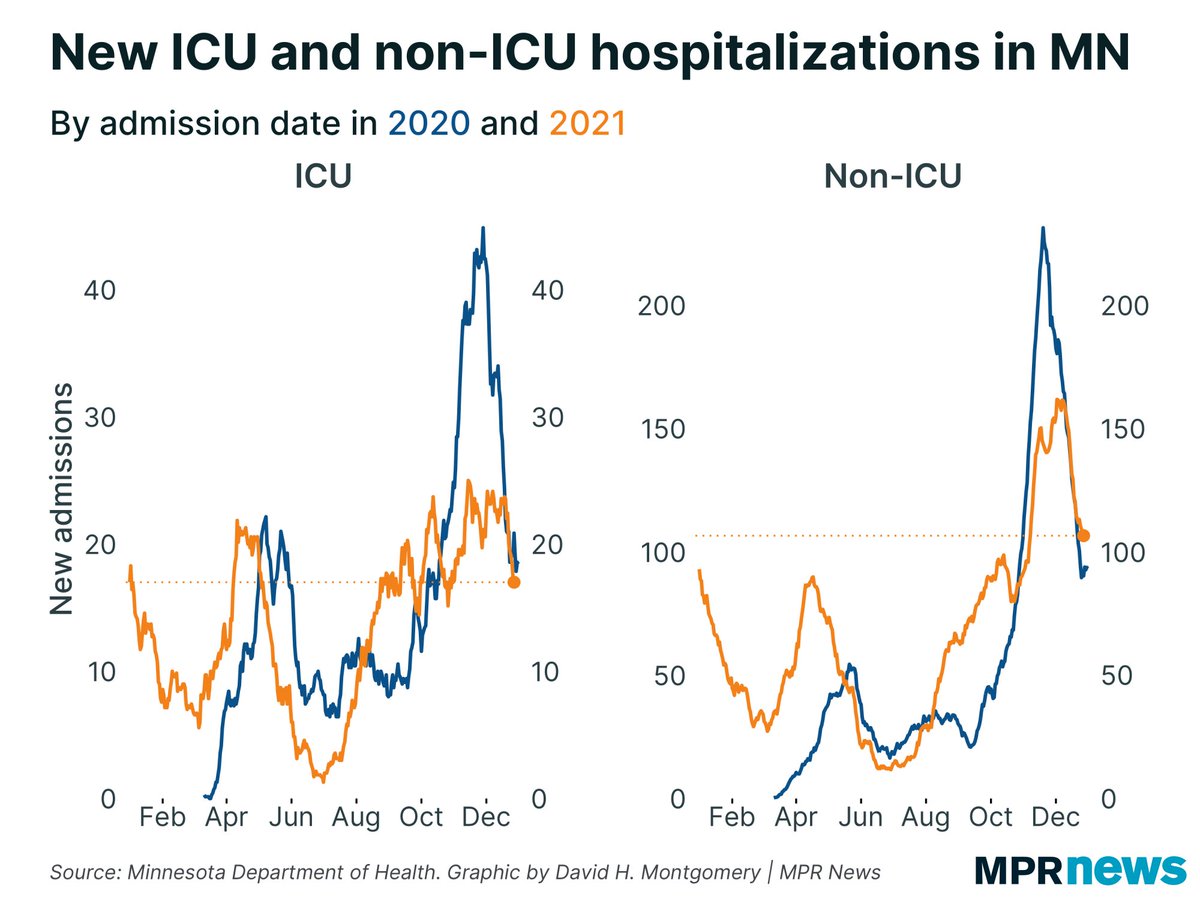
@mnhealth We’re not seeing an OVERALL bump in hospitalizations yet, which is good. But hospitalizations lag cases, so it might just be too early for this wave to show up.

And we ARE seeing a bump in COVID hospital bed use in the metro area, where most of the new cases are.
@mnhealth Death rates are thankfully still falling or flat, but remember this lags case counts by WEEKS. It doesn’t tell you anything about what’s happening right now, it tells you what was happening weeks ago.
Can’t wait until next week when we’ll have enough data for these year-over-year charts to work again.
MN’s rate of new vaccinations remains pretty low. Boosters are falling, too, after a pretty strong initial run.
Overall about 72% of Minnesotans have at least one dose, 66% are fully vaccinated, and 31% are boosted.
In case you were wondering, most of the doses MN is giving out (which are mostly boosters at this point) are Pfizer. J&J continues to be practically nonexistent, except for that first bump back in March/April.
Overall, about 90% of Minnesotans with at least one dose are fully vaccinated, and more than 40% are boosted.

Note these are approximations from population-level data, not based on individual-level data. So subject to some reporting errors. Take as approximate.

• • •

Missing some Tweet in this thread? You can try to force a refresh
 

Keep Current with David H. Montgomery

David H. Montgomery Profile picture

Stay in touch and get notified when new unrolls are available from this author!

Read all threads

This Thread may be Removed Anytime!

PDF

Twitter may remove this content at anytime! Save it as PDF for later use!

Try unrolling a thread yourself!

how to unroll video
  1. Follow @ThreadReaderApp to mention us!

  2. From a Twitter thread mention us with a keyword "unroll"
@threadreaderapp unroll

Practice here first or read more on our help page!

More from @dhmontgomery

6 Jan
Unfortunately, today’s #COVID19 data in MN has yet another backlog situation.

A few days ago the share of MN’s total tests that were antigens spiked upward. Turns out that’s because a bunch of PCR tests weren’t making their way into reports. (People still got notified.) Image
Even more unfortunately, @mnhealth is going to be updating their TEST totals today — 135,000 backlogged tests from the past week or so — but CASES from this backlog will get updated over the next few days.

So all our messy data just got even more messed up. Buckle up.
The end result: MN’s positivity rate is going to look artificially low today, and this will linger into next week until all these backlogged cases are finally processed. So don’t let this mislead you about how things are going in MN.
Read 11 tweets
4 Jan
Today’s #COVID19 report in MN reflects 4 days of data, important context for the record 16K cases reported.

BUT STILL: Today’s report is eye-popping. The omicron spike is *here*. And this is just one part of the state, the Twin Cities metro, being hit. Greater MN still flat-ish
This surge in cases is being led by 20-something adults, but we’re seeing spikes in every age group except seniors.
Hospitalizations lag behind case counts a bit, but there are some suggstions that MN’s decline in #COVID19 bed use may have leveled off.
Read 7 tweets
3 Jan
Minnesota is clearly seeing cases and positivity rise.

What’s not clear is the degree to which this is an omicron explosion like other states have seen, vs. a more temporary holiday bump. (Some of both to be sure.)

Note that a 2022 line won’t show until we’ve got 2 data points.
Note: Today’s #COVID19 report in MN is actually what we would have gotten last Friday if not for the holiday; most of today’s newly reported cases were from last Monday and Tuesday.

All our data is affected by the holidays now and should be taken with a big grain of salt.
Fortunately, new #COVID19 hospital admisions are still falling. (Remember this data is through the end of last week, no 2022 yet.)

Hospitalization data lags behind cases, so we might not necessarily expect this to rise yet — though some evidence omicron is milder. Wait & see.
Read 7 tweets
13 Dec 21
1/ This can be somewhat counterintuitive, so it's not surprising many people are confused.

First, numbers: For the period where we've got data (May-Nov.) MN has 1,868 COVID deaths, of which 718 were fully vaccinated & 1,150 not; most of these deaths were in the past few months.
2/ Over this period, the share of MN's population that's fully vaccinated has grown from about 40% up to about 60% (with, again, more of the deaths happening in these later period where vax rates were higher).
3/ But remember 96.5% of MN's #COVID19 deaths have been over 50, and nearly 85% were 65+. So when estimating deaths, we REALLY need to adjust for age.
Read 11 tweets
13 Dec 21
The big Q in MN’s #COVID19 stats this week is whether the encouraging drops we saw last week will continue.

Today’s stats are cautiously encouraging. Cases dropped, but some of that was driven by falling testing volume. Positivity rate ony inched down.
Tomorrow’s multi-day data dump will have a bigger swing on the data. Tuesday reports usually include twice as many total tests as Monday reports do.

Obviously we’d have loved to see a bigger drop here, but there’s nothing alarming here.
New #COVID19 hospital admissions continue to rise, especially for non-ICU beds.

By this time last year hospitalization data had already begun to fall steadily. (Our Fall 2020 wave peaked earlier than our possible peak now.)
Read 8 tweets
7 Dec 21
The good news in today’s #COVID19 report for MN: as I said yesterday, data issues had artificially inflated our positivity rate; today’s data sorted that out.

The bad news: we’re still (just) north of 10% and much higher than the 9.2% we were at last last week.
You can see this spike and fall as a near mirror-image of last year — off by one day, in fact. This isn’t so much seasonal patterns in Thanksgiving *infection* as seasonal patterns in Thanksgiving *reporting*.

The rest of this week will be key to figuring out where we’re headed.
That said, seasonal patterns in infections are playing a role here, too. Here’s our sample-date positivity chart (which lags by a week), also closely matching last year.
Read 13 tweets

Did Thread Reader help you today?

Support us! We are indie developers!


This site is made by just two indie developers on a laptop doing marketing, support and development! Read more about the story.

Become a Premium Member ($3/month or $30/year) and get exclusive features!

Become Premium

Too expensive? Make a small donation by buying us coffee ($5) or help with server cost ($10)

Donate via Paypal

Or Donate anonymously using crypto!

Ethereum

0xfe58350B80634f60Fa6Dc149a72b4DFbc17D341E copy

Bitcoin

3ATGMxNzCUFzxpMCHL5sWSt4DVtS8UqXpi copy

Thank you for your support!

Follow Us on Twitter!

:(