Unfortunately, today’s #COVID19 data in MN has yet another backlog situation.

A few days ago the share of MN’s total tests that were antigens spiked upward. Turns out that’s because a bunch of PCR tests weren’t making their way into reports. (People still got notified.)
Even more unfortunately, @mnhealth is going to be updating their TEST totals today — 135,000 backlogged tests from the past week or so — but CASES from this backlog will get updated over the next few days.

So all our messy data just got even more messed up. Buckle up.
The end result: MN’s positivity rate is going to look artificially low today, and this will linger into next week until all these backlogged cases are finally processed. So don’t let this mislead you about how things are going in MN.
Charts coming once I finish sorting through this mess...
OK. I won’t be sharing some of my usual charts today because the underlying data is messed up. Here’s some useful things we can take from the data.
Most of today’s cases (ignoring the backlogged negative tests to the degree we can) came from tests conducted on Sunday and Monday.
In the past, we’ve seen a big spike of positive cases after holidays. And so far (this is incomplete and preliminarily) that came true in a big way the Sunday after NYE. More than 30% of tests conducte that day (so far) have been positive. If this holds, a new daily record.
Want to see what this omicron spike looks like in MN? Here’s the positivity rate by AGE in Minnesota for last week. Over 20% for 20-somethings! Teens and 30-somethings not far behind.
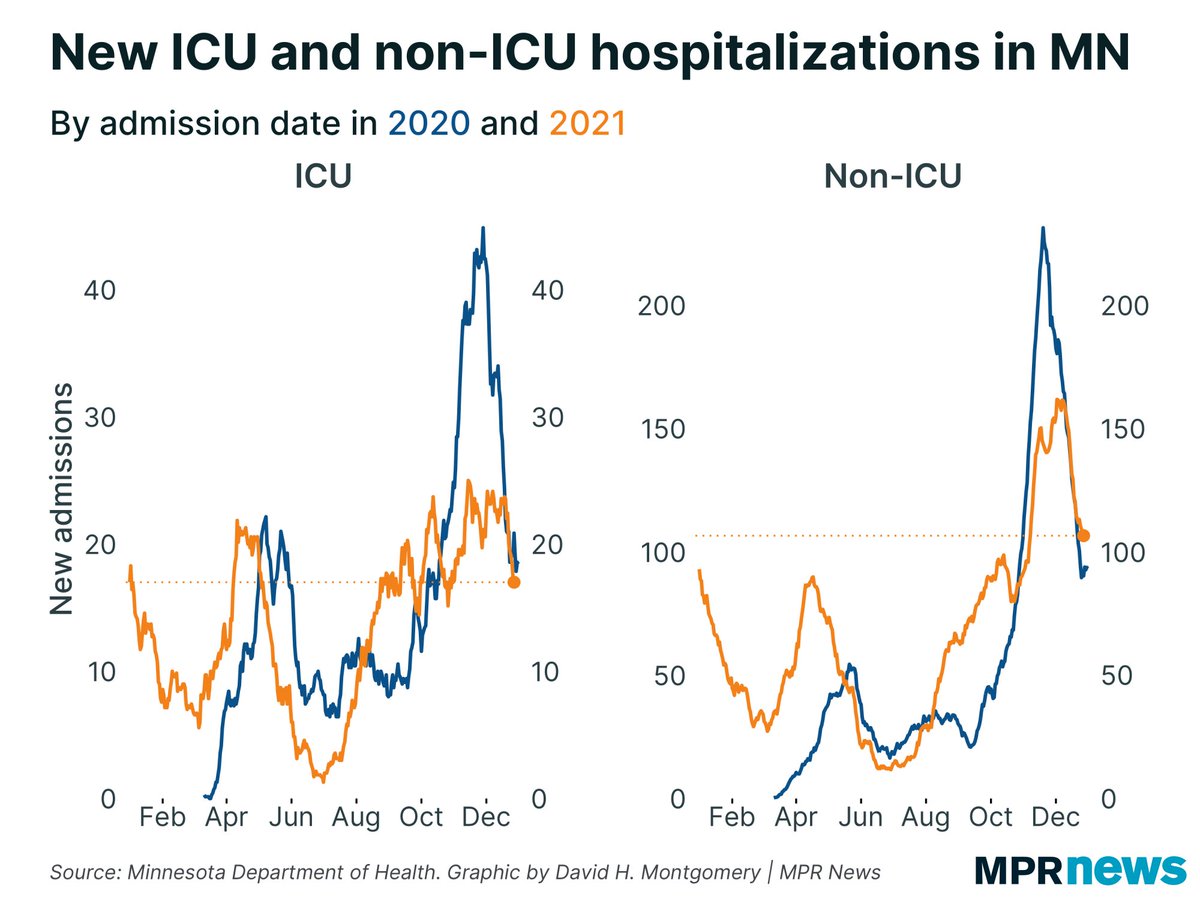
#COVID19 hospital bed use has started to rise again. Especially in the metro, but not exclusively there.
Don’t read too much into the slowdown in new metro-area cases here, because of messy data. I share this to note that parts of rural Minnesota are now starting to see cases rise again, including SE and NW MN.
In summary, all the numbers are messed up. There’s no reason yet to suspect any change to recent trends (massive spike, esp. in the Twin Cities) but I’ll keep watching and try to clean everything up.

The next few reports will be inflated a bit by backlogged cases.

• • •

Missing some Tweet in this thread? You can try to force a refresh
 

Keep Current with David H. Montgomery

David H. Montgomery Profile picture

Stay in touch and get notified when new unrolls are available from this author!

Read all threads

This Thread may be Removed Anytime!

PDF

Twitter may remove this content at anytime! Save it as PDF for later use!

Try unrolling a thread yourself!

how to unroll video
  1. Follow @ThreadReaderApp to mention us!

  2. From a Twitter thread mention us with a keyword "unroll"
@threadreaderapp unroll

Practice here first or read more on our help page!

More from @dhmontgomery

7 Jan
Found this amazing c. 1852 piece of dataviz: a propaganda medallion featuring Napoleon III’s electoral margins in every French department in the referendum on whether to re-establish the French empire. (He “won” with 96.9% support.) Image
The back is also fascinating, featuring Bonapartist slogans:

The voice of the people is the voice of God
The voice of God is universal suffrage
Universal suffrage is true legitimacy
True legitimacy is stability
Stability is heredity
Heredity is peace
Peace is progress
... Image

Progress is work
Work is happiness for all
Happiness for all is improving everyone’s lot

“Improving everyone’s lot is the most sincere and ardent wish of Louis-Napoléon. Long live the Emperor! Forever and ever.” Image
Read 4 tweets
7 Jan
MN’s #COVID19 data continues to be very messy — nearly 5,000 backlogged cases from last week in today’s report, and more likely to come in the next few reports. Image
As a result it’s hard to tell exactly what’s going on. Some measures are up, some down.

SO FAR the last few days we’re not seeing the giant *increases* in cases/positivity we saw starting around Christmas. But it’s too early to celebrate. ImageImage
As of the equivalent report last week (released on Monday instead of Friday due to the holidays), we had reported about 6,100 cases from Monday (12/27) on 44K tests.

As of now, we’re at 4,400 cases from Monday (1/3) on 67K tests.

But slow case processing could explain this.
Read 8 tweets
5 Jan
Today’s #COVID19 report in Minnesota showed a week-over-week drop in raw cases.

But if you’re not yet adjusting for testing volume, here in the year 2022, you may be beyond my help. The news is still bad; our average positivity rate shot up again, to 15%.
Today’s data are a little weird. We’ve got a big chunk of cases from last Thursday, before NYE, & then a big chunk of cases from the holiday weekend, when few people got tested but a lot of the ones who did were positive.

Again, never read too much into any one day’s report.
Newly reported cases fell overall today, due to lower testing volume, and @mnhealth only releases test totals/positivity rate by county on Thursdays for some reason, but w/ that, overall we’ve still got new cases in Hennepin/Ramsey higher than they’ve ever been all pandemic.
Read 10 tweets
4 Jan
Today’s #COVID19 report in MN reflects 4 days of data, important context for the record 16K cases reported.

BUT STILL: Today’s report is eye-popping. The omicron spike is *here*. And this is just one part of the state, the Twin Cities metro, being hit. Greater MN still flat-ish
This surge in cases is being led by 20-something adults, but we’re seeing spikes in every age group except seniors.
Hospitalizations lag behind case counts a bit, but there are some suggstions that MN’s decline in #COVID19 bed use may have leveled off.
Read 7 tweets
3 Jan
Minnesota is clearly seeing cases and positivity rise.

What’s not clear is the degree to which this is an omicron explosion like other states have seen, vs. a more temporary holiday bump. (Some of both to be sure.)

Note that a 2022 line won’t show until we’ve got 2 data points.
Note: Today’s #COVID19 report in MN is actually what we would have gotten last Friday if not for the holiday; most of today’s newly reported cases were from last Monday and Tuesday.

All our data is affected by the holidays now and should be taken with a big grain of salt.
Fortunately, new #COVID19 hospital admisions are still falling. (Remember this data is through the end of last week, no 2022 yet.)

Hospitalization data lags behind cases, so we might not necessarily expect this to rise yet — though some evidence omicron is milder. Wait & see.
Read 7 tweets
13 Dec 21
1/ This can be somewhat counterintuitive, so it's not surprising many people are confused.

First, numbers: For the period where we've got data (May-Nov.) MN has 1,868 COVID deaths, of which 718 were fully vaccinated & 1,150 not; most of these deaths were in the past few months.
2/ Over this period, the share of MN's population that's fully vaccinated has grown from about 40% up to about 60% (with, again, more of the deaths happening in these later period where vax rates were higher).
3/ But remember 96.5% of MN's #COVID19 deaths have been over 50, and nearly 85% were 65+. So when estimating deaths, we REALLY need to adjust for age.
Read 11 tweets

Did Thread Reader help you today?

Support us! We are indie developers!


This site is made by just two indie developers on a laptop doing marketing, support and development! Read more about the story.

Become a Premium Member ($3/month or $30/year) and get exclusive features!

Become Premium

Too expensive? Make a small donation by buying us coffee ($5) or help with server cost ($10)

Donate via Paypal

Or Donate anonymously using crypto!

Ethereum

0xfe58350B80634f60Fa6Dc149a72b4DFbc17D341E copy

Bitcoin

3ATGMxNzCUFzxpMCHL5sWSt4DVtS8UqXpi copy

Thank you for your support!

Follow Us on Twitter!

:(