A fuller update on hospitals in England today, including admissions by age and hospital deaths.

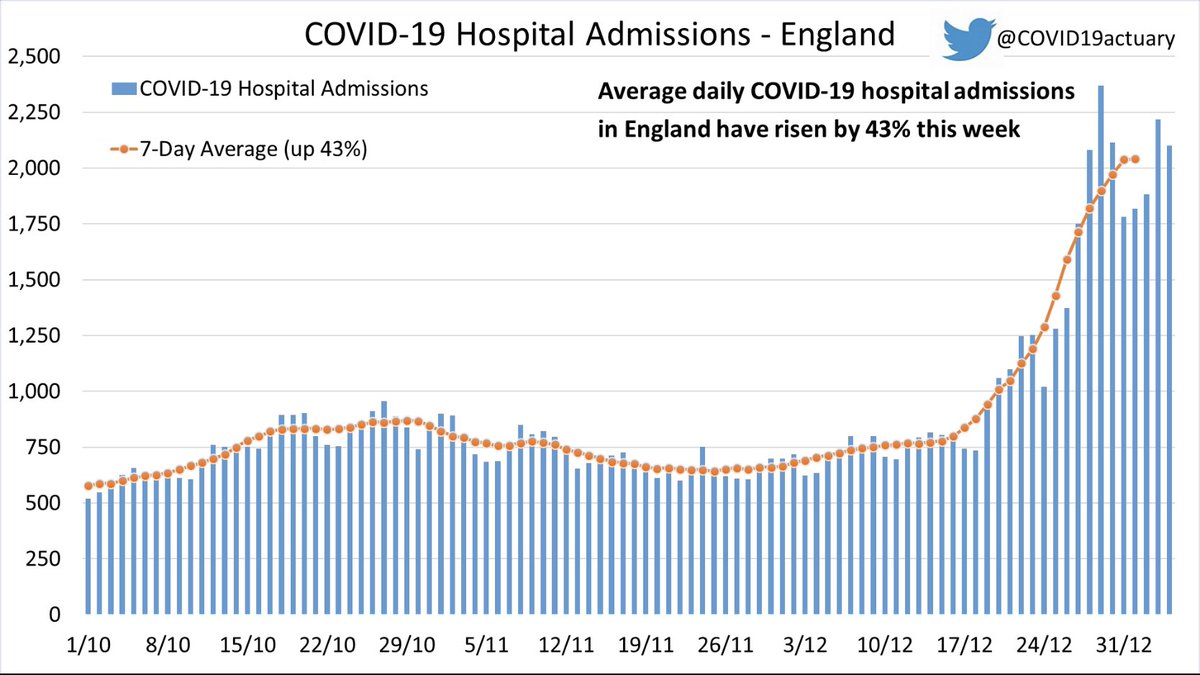
Nationally, admissions with COVID are up by 43% week-on-week, but the rate of growth has slowed significantly. Today’s total is very similar to the total reported a week ago. 1/6 Image
The regional picture is very mixed but growth has been slower everywhere. The change is most pronounced in London, where the 7-day average has fallen in recent days. The fastest growth has been the North West, up 84%. 2/6 Image
Breaking down admissions by age, the 18-64 age group has fallen in the last few days. The older age groups are still increasing but there are signs that the pace has slowed for these too. 3/6 Image
This chart compares actual hospital admissions with modelled scenarios produced by SPI-M-O teams, including a recent update from @cmmid_lshtm to incorporate Omicron. If there is no further uptick in admissions then the peak will be lower than the modelled scenarios. 4/6 Image
COVID-19 hospital bed occupancy in England is now above 16,000 beds occupied. Mechanical Ventilation bed occupancy is down by 3% week-on-week, while other bed occupancy is up by 43%. The proportion of COVID patients in mechanical ventilation beds is the lowest it has been. 5/6 Image
COVID-19 deaths in English hospitals increased by 25% week-on-week.

With COVID prevalence so high this will include more who people who died of other causes, but with COVID, than usual.

Purple estimates are based on the pattern of reporting delays in the last two months. 6/6 Image

• • •

Missing some Tweet in this thread? You can try to force a refresh
 

Keep Current with COVID-19 Actuaries Response Group

COVID-19 Actuaries Response Group Profile picture

Stay in touch and get notified when new unrolls are available from this author!

Read all threads

This Thread may be Removed Anytime!

PDF

Twitter may remove this content at anytime! Save it as PDF for later use!

Try unrolling a thread yourself!

how to unroll video
  1. Follow @ThreadReaderApp to mention us!

  2. From a Twitter thread mention us with a keyword "unroll"
@threadreaderapp unroll

Practice here first or read more on our help page!

More from @COVID19actuary

29 Dec 21
Latest data on COVID-19 hospital admissions and occupancy in England shows a significant increase in admissions nationally, up 54% week-on-week. 1,751 admissions were reported today.

Most of the charts that follow have been rescaled significantly in light of the latest data. 1/5
Looking at the regional data it is now clear that the rest of the country is following the sharp increase seen in London. Admissions up by more than 50% in most regions, but smaller increases for now in the South East (up 38%) and South West (up 15%). 2/5
This chart compares actual hospital admissions with modelled scenarios produced by SPI-M-O teams, including the latest update from @cmmid_lshtm to incorporate Omicron. Admissions seem to be slightly ahead of the modelled peak but tracking it closely. 3/5
Read 7 tweets
15 Dec 21
Latest data on COVID-19 hospital admissions, occupancy and deaths in England has been released.

Starting with the regional picture this week as there has been a rapid acceleration in London with admissions up by 38% week-on-week. Increases are much more gradual elsewhere. 1/5
For England as a whole, COVID-19 hospital admissions are up by 10% this week, largely driven by the big increase in London.
SAGE released new modelling provided by SPI-M-O teams in October. Actual hospital admissions are currently higher than the modelled scenarios, which did not capture the increase in admissions in October. Admissions are no longer following the downward trajectory modelled. 3/5
Read 5 tweets
14 Dec 21
The Continuous Mortality Investigation (CMI) has published its latest Mortality Monitor to 3 December (week 48).

There were 3% more deaths this week than if death rates were the same as week 48 of 2019. That is 383 excess deaths in England and Wales this week. Image
CMI calculates 116,900 excess deaths in the UK since the start of the pandemic, of which 44,000 occurred in 2021.

Cumulative mortality YTD is 6.3% of a full year's mortality above 2019, though for now it remains lower than 2012, 2013, 2015 and of course 2020. Image
This analysis of death rates shows significantly fewer excess deaths than COVID deaths this week, as was also the case last week. This follows a long period where the calculated excess was consistently similar to the number of COVID deaths each week. Image
Read 5 tweets
8 Dec 21
What is known and what is still to be determined in respect of Omicron? How should we think about next steps when faced with uncertainty?

In our new blog @AdeleGroyer and Stephen Kramer summarise the current state of knowledge and consider how to respond.
covidactuaries.org/2021/12/08/omi…
The effective reproduction number, R, has risen significantly in South Africa since early November, but as @trvrb shows, this may be due to a higher R0, greater immune escape, or a mixture of the two.

Initial findings suggest that Omicron *may* have less severe impacts than were seen for other variants. @MRCza states that it will take another two weeks before one can draw more precise conclusions about disease severity.
Read 7 tweets
8 Dec 21
Latest data on COVID-19 hospital admissions, bed occupancy and hospital deaths in England has been released.

Admissions have been rising. Nationally, the moving average is up by 6% week-on-week. There are large increases in some of the regions, discussed below. 1/5
One by one the regions have been going back into growth in admissions. The South East (up 17%) and London (up 14%) have seen the biggest increases. Admissions are up 11% in the East and 4% in the Midlands. Only NE & Yorks saw a fall this week, with no change in SW or NW. 2/5
SAGE released new modelling provided by SPI-M-O teams in October. Actual hospital admissions are currently higher than the modelled scenarios, which did not capture the increase in admissions in October, but were following the downward trajectory until this week. 3/5
Read 5 tweets
20 Oct 21
Latest data on COVID-19 hospital admissions, bed occupancy and hospital deaths in England has been released.

Nationally, admissions have risen sharply, up 23% this week. We look set to exceed the July peak in the next few days.

The regional picture is discussed below. 1/6
All regions have seen significant increases in COVID hospital admissions this week. The smallest increases were in the South West (up 11%) and the Midlands (up 14%). The biggest jumps are in the South East (up 44%) and London (up 36%). 2/6
Of concern, admissions have been accelerating, that is, the rate of increase has itself been increasing. Our estimate of R, based on hospital admissions, has risen above 1.1 and does not yet appear to have peaked. 3/6
Read 6 tweets

Did Thread Reader help you today?

Support us! We are indie developers!


This site is made by just two indie developers on a laptop doing marketing, support and development! Read more about the story.

Become a Premium Member ($3/month or $30/year) and get exclusive features!

Become Premium

Too expensive? Make a small donation by buying us coffee ($5) or help with server cost ($10)

Donate via Paypal

Or Donate anonymously using crypto!

Ethereum

0xfe58350B80634f60Fa6Dc149a72b4DFbc17D341E copy

Bitcoin

3ATGMxNzCUFzxpMCHL5sWSt4DVtS8UqXpi copy

Thank you for your support!

Follow Us on Twitter!

:(