NSW R_eff as of January 9th with daily cases and restrictions. Latest estimate: R_eff = 1.41 ± 0.08

Plus SIR model projection.

Cases shown on a linear scale (log scale in next tweet).

More info chrisbillington.net/COVID_NSW.html

#covid19nsw #covidsydney
NSW R_eff as of January 9th with daily cases and restrictions. Latest estimate: R_eff = 1.41 ± 0.08

Plus SIR model projection.

(Cases shown on a log scale)

More info chrisbillington.net/COVID_NSW.html

#covid19nsw #covidsydney
R_eff in Greater Sydney vs rest of New South Wales:

Greater Sydney: R_eff = 1.85 ± 0.09
NSW excluding Greater Sydney: R_eff = 2.32 ± 0.16

(Cases shown on a log scale)

(note region-specific data is several days old, does not include today's cases)

#covid19nsw #covidsydney
R_eff in LGAs of concern* vs the rest of NSW (*all of Penrith included):

LGAs of concern: R_eff = 1.99 ± 0.08
Rest of NSW: R_eff = 1.95 ± 0.11

(Cases shown on a log scale)

(note LGA data is several days old, does not include today's cases)

#covid19nsw #covidsydney
The Hunter region: R_eff = 2.21 ± 0.26

Illawarra region: R_eff = 2.80 ± 0.27

Western New South Wales: R_eff = 3.66 ± 0.56

(Cases shown on a log scale)

(note region-specific data is several days old, does not include today's cases)

#covid19nsw #covidsydney
Cases in NSW if the current trend continues:

day cases 68% range
Mon: 39655 35691—43704
Tue: 40567 36265—45004
Wed: 41081 36474—45801
Thu: 41154 36352—46103
Fri: 40786 35880—45834
Sat: 39981 35052—45023
Sun: 38800 33922—43736

Doubling time is 10.1 days.

• • •

Missing some Tweet in this thread? You can try to force a refresh
 

Keep Current with Chris Billington

Chris Billington Profile picture

Stay in touch and get notified when new unrolls are available from this author!

Read all threads

This Thread may be Removed Anytime!

PDF

Twitter may remove this content at anytime! Save it as PDF for later use!

Try unrolling a thread yourself!

how to unroll video
  1. Follow @ThreadReaderApp to mention us!

  2. From a Twitter thread mention us with a keyword "unroll"
@threadreaderapp unroll

Practice here first or read more on our help page!

More from @Chrisbilbo

9 Jan
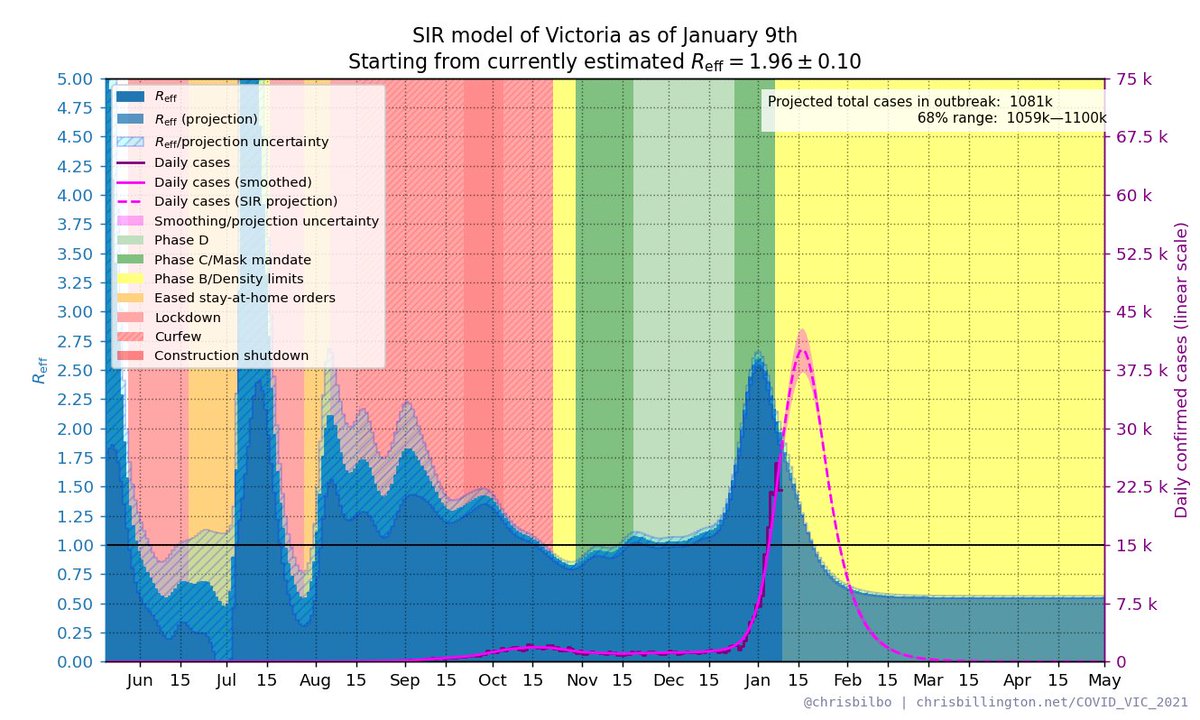
VIC R_eff as of January 9th with daily cases and restrictions. Latest estimate: R_eff = 1.96 ± 0.10

Plus SIR model projection.

Cases shown on a linear scale (log scale in next tweet).

More info chrisbillington.net/COVID_VIC_2021…

#COVID19Vic ImageImage
VIC R_eff as of January 9th with daily cases and restrictions. Latest estimate: R_eff = 1.96 ± 0.10

Plus SIR model projection.

(Cases shown on a log scale)

More info chrisbillington.net/COVID_VIC_2021…

#COVID19Vic ImageImage
Cases in VIC if the current trend continues:

day cases 68% range
Mon: 28281 25903—30742
Tue: 30939 28189—33797
Wed: 33482 30331—36691
Thu: 35707 32263—39301
Fri: 37606 33864—41473
Sat: 39006 35068—43041
Sun: 39862 35846—43962

Doubling time is 5.2 days.

#COVID19Vic
Read 4 tweets
8 Jan
TAS R_eff as of January 8th with daily cases. Latest estimate: R_eff = 2.74 ± 0.42

Plus SIR model projection.

Cases shown on a linear scale (log scale in next tweet).

More info chrisbillington.net/COVID_TAS.html
TAS R_eff as of January 8th with daily cases. Latest estimate: R_eff = 2.74 ± 0.42

Plus SIR model projection.

(Cases shown on a log scale)

More info chrisbillington.net/COVID_TAS.html
Cases in TAS if the current trend continues:

day cases 68% range
Sun: 1521 1136—1942
Mon: 1787 1319—2300
Tue: 2082 1523—2702
Wed: 2404 1737—3146
Thu: 2746 1967—3616
Fri: 3096 2196—4081
Sat: 3432 2426—4534

Doubling time is 3.4 days.
Read 4 tweets
7 Jan
With the projected peak of the NSW outbreak approaching, it's worth showing how sensitive my projection is to one of its main assumptions: the fraction of infections that are being captured by testing. 1/6
Current projection is based on the assumption that 20% of infections are being detected. That implies there are a lot of infections contributing to immunity that have not been detected via testing. 2/6
If the detection rate is higher, say, 30%, then there are not as many undetected infections out there, and therefore less immunity. High immunity is required for infections to peak, so that implies the peak is a little further away (and higher, in terms of detected cases) 3/6
Read 7 tweets
7 Jan
VIC R_eff as of January 8th with daily cases and restrictions. Latest estimate: R_eff = 2.34 ± 0.09

Plus SIR model projection.

Cases shown on a linear scale (log scale in next tweet).

More info chrisbillington.net/COVID_VIC_2021…

#COVID19Vic
VIC R_eff as of January 8th with daily cases and restrictions. Latest estimate: R_eff = 2.34 ± 0.09

Plus SIR model projection.

(Cases shown on a log scale)

More info chrisbillington.net/COVID_VIC_2021…

#COVID19Vic
Cases in VIC if the current trend continues:

day cases 68% range
Sun: 28746 26792—30732
Mon: 32450 30130—34762
Tue: 36138 33480—38795
Wed: 39639 36639—42639
Thu: 42778 39446—46015
Fri: 45305 41808—48769
Sat: 47084 43463—50605

Doubling time is 4.1 days.

#COVID19Vic
Read 4 tweets
7 Jan
NSW R_eff as of January 8th with daily cases and restrictions. Latest estimate: R_eff = 1.69 ± 0.07

Plus SIR model projection.

Cases shown on a linear scale (log scale in next tweet).

More info chrisbillington.net/COVID_NSW.html

#covid19nsw #covidsydney
NSW R_eff as of January 8th with daily cases and restrictions. Latest estimate: R_eff = 1.69 ± 0.07

Plus SIR model projection.

(Cases shown on a log scale)

More info chrisbillington.net/COVID_NSW.html

#covid19nsw #covidsydney
R_eff in Greater Sydney vs rest of New South Wales:

Greater Sydney: R_eff = 1.85 ± 0.09
NSW excluding Greater Sydney: R_eff = 2.32 ± 0.16

(Cases shown on a log scale)

(note region-specific data is several days old, does not include today's cases)

#covid19nsw #covidsydney
Read 6 tweets
6 Jan
NSW R_eff as of January 7th with daily cases and restrictions. Latest estimate: R_eff = 1.76 ± 0.08

Plus SIR model projection.

Cases shown on a linear scale (log scale in next tweet).

More info chrisbillington.net/COVID_NSW.html

#covid19nsw #covidsydney ImageImage
NSW R_eff as of January 7th with daily cases and restrictions. Latest estimate: R_eff = 1.76 ± 0.08

Plus SIR model projection.

(Cases shown on a log scale)

More info chrisbillington.net/COVID_NSW.html

#covid19nsw #covidsydney ImageImage
R_eff in Greater Sydney vs rest of New South Wales:

Greater Sydney: R_eff = 1.80 ± 0.09
NSW excluding Greater Sydney: R_eff = 2.02 ± 0.13

(Cases shown on a log scale)

(note region-specific data is several days old, does not include today's cases)

#covid19nsw #covidsydney ImageImage
Read 6 tweets

Did Thread Reader help you today?

Support us! We are indie developers!


This site is made by just two indie developers on a laptop doing marketing, support and development! Read more about the story.

Become a Premium Member ($3/month or $30/year) and get exclusive features!

Become Premium

Too expensive? Make a small donation by buying us coffee ($5) or help with server cost ($10)

Donate via Paypal

Or Donate anonymously using crypto!

Ethereum

0xfe58350B80634f60Fa6Dc149a72b4DFbc17D341E copy

Bitcoin

3ATGMxNzCUFzxpMCHL5sWSt4DVtS8UqXpi copy

Thank you for your support!

Follow Us on Twitter!

:(