Very excited to share this new paper with the fantastic @ZiYangKang, out on NBER today.
Thread 👇 with an overview.
nber.org/papers/w29656
Thread 👇 with an overview.
nber.org/papers/w29656

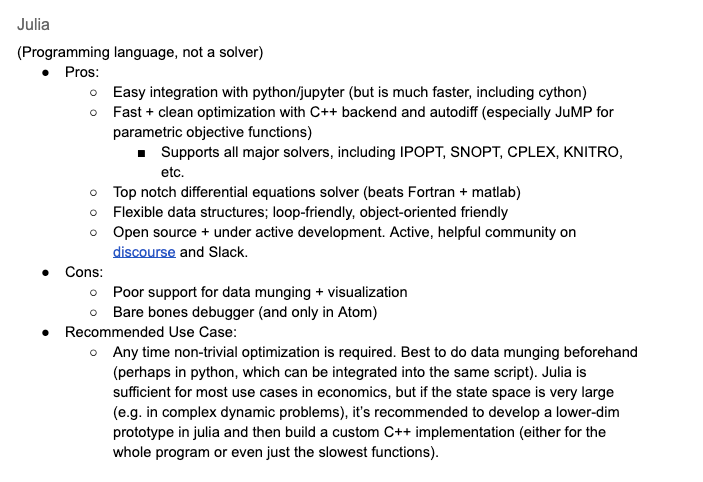
Here's the gist: a common exercise in empirical econ is to analyze the effects of a policy change by taking obs of price/quantity pairs, fitting a demand curve and integrating under it to get a measure of welfare (e.g. consumer surplus; deadweight loss). Here's an example.

But curve fitting usually requires assumptions: how do you interpolate between discrete points?
In most cases, ppl use a standard functional form: linear, logit, CES, etc. With enough data + model flexibility, this isn't too restrictive. But what about when there isn't enough data for non-parametric arguments to take hold?
The idea of our paper is to propose an alternative approach: instead of estimating a demand curve that "reasonably" captures preferences & integrating to get welfare, compute the biggest/smallest welfare that is consistent with *any* "reasonable" demand curve.
So what do we mean by "reasonable"? Our pitch is that domain experts generally have intuitions about economic assumptions that apply to their setting. These could be high level ass'mts re the shape of demand: e.g. Q 👇 as P 👆; Q is log-concave; the elasticity of Q is b/w a & b.
Where might these assumptions come from? Could be from experience (e.g. "these pts don't look convex"); or from theory (e.g. log-concavity is necessary for Bertrand eqm existence); or from previous studies (e.g. "the lit has typically found elasticities b/w -3.18 and -0.01").

Okay so what can we do with this? Turns out that in many cases, we can do quite a bit. Say you observe prices and quantities just before and just after a tax hike, and you want to measure DWL. This is area "B" in the picture.

If you knew the shape of the demand curve D(p) you'd be good to go: integrate b/w p0 and p1. But if you don't know D(p) what do you do? Interpolation means fitting a parametric curve b/w (p0, q0) and (p1, q1). Here's how a linear interpolation looks.
Easy, but a strong assum'tn.
Easy, but a strong assum'tn.
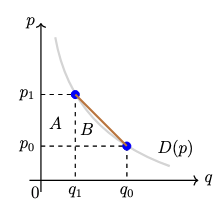
Suppose that instead you wanted to be really conservative and only assume that Q 👇 as P 👆. Varian 82 shows that you can get an upper+lower bound on B by drawing a "box". The biggest B could be is if D(p) is flat at p1 & jumps down instantaneously to (p0, q0): the red curve.
The smallest B could be is if D(p) is flat at p0 & jumps up instantaneously to (p1,q1): the green curve. Now, the lower bound under the green curve is zero--not super meaningful. But you can see in the graph that the upper bound on B is informative: it's 2x the linear estimate.
Now the box bounds might still be pretty wide, but remember that we've assumed nothing but monotonicity. Sure, the red & green curves are monotonic in p but we can probably safely assume that our real-life demand function does not look like that.
So what could our demand function look like? We consider a menu of options that seem likely to be useful. First, we suppose that the researcher can bound the range of elasticities along the demand curve. This is a relaxation of the box, which has elasticity -infty or 0 a.e.

We then consider a series of assumptions re the curvature of demand: convexity/concavity, log-convexity/concavity, decreasing elasticities, decreasing marginal returns (and some relaxations). We also consider combining assumptions, allowing for more points & counterfactuals.


Our results show how to take a set of assumptions about the D(p) and attain an upper & lower bound on area B. For the simplest cases, we derive the bounds with an intuitive geometric proof. For harder ones, we present a general approach in the appendix.
Interestingly, it turns out that the extremal curves that bound welfare for common curvature assumptions (i.e. the analogues of the red & green curves in the box bounds) are actually common functional forms themselves!

For example, the lower bound on B under "Marshall's second law" (decreasing elasticities) is a simple CES curve! This means that when we see a DWL estimate from a tax/tariff in a paper that assumes CES demand, we are not getting an innocuous approx; we're getting the lower bound!
Okay, but the proof is in the pudding, as they say. How do the bounds look in applied research? In this paper we focus on the simplest case (caveats in a few tweets), but we think it's pretty powerful already. To prove it, we work out 3 empirical applications in 3 diff't fields.
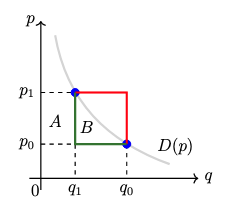
We start out by looking at DWL from the 2018 trade war following Amiti, Redding and Weinstein (2019). Assuming (following empirical evidence) that producer surplus ≈ 0 & comparing product-month pairs from 2017 to 2018, we get a setup quite like our example.


Amiti, Redding and Weinstein (2019) assume demand is linear (via a Taylor approx); other papers studying the 2018 tariffs assume a type of CES demand. Does it matter? As we see here, the diffs b/w interpolations is quite big by the end of 2018 when tariffs were high/wide-spread.
We show how our bounding method can be used to approach this problem in a principled way. We'll leave it to the trade economists to tell us what reasonable assumptions to make here would be, but we show a few examples of how to derive bounds and evaluate robustness.

We then look at income taxation, following one of the canonical papers in the sufficient statistics literature: Feldstein (1999). The tl;dr of this paper is that for small changes in tax rates, the marginal change in welfare is a simple fn of the elasticity of taxable income.

How do you go from marginal change estimates to evaluating the (absolute) change due to a recent hike? You have to interpolate. Feldstein's approach is equivalent to a linear interpolation. But it's the same type of problem at the end of the day, and we can compute robust bounds.

Let's take an illustrative example Feldstein uses: a taxpayer making $180k, whose marginal tax rate increased from 31% to 38.9% in 1993. Feldstein uses an elasticity estimate from his '95 paper but the metrics are a bit confusing & he mentions diff't ests from contemporary papers

To be safe, we take the range of elasticites that Feldstein discusses as boundary cases & use that as the basis for elasticity constraints. These correspond to the teal triangles in the left hand side of the figure (w/o further assums); the red triangles correspond to box bounds.

Elasticity constraints really narrow the range of welfare estimates in this case. Combining elasticity constraints with curvature assumptions can make things even tighter---but of course, it depends on what is reasonable to assume about the shape of the taxable income function.
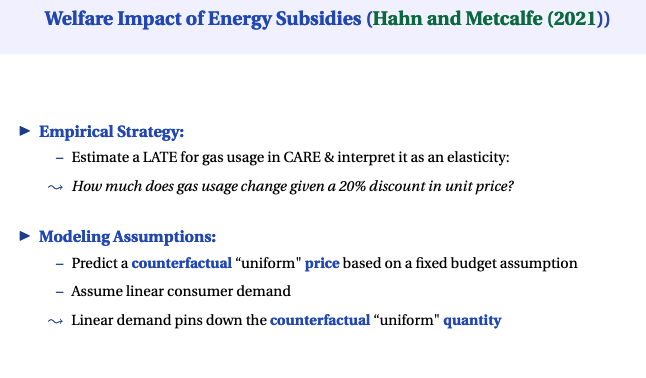
Finally, we look at an application to evaluating energy subsidies, following Hahn and Metcalfe (2021). This paper looks at the welfare impact of a gas subsidy for poor households via the CARE program in California.

This setup is a bit more complicated: CARE households get a discounted price per unit of gas which is good for their consumer surplus. But they use more gas, which is environmentally costly & their discount is subsidized by other households who incur a higher unit price.

Hahn and Metcalfe estimate the demand elasticity for CARE households with a clever LATE design, and take an estimate of the non-CARE elasticity from another paper. They then apply a linear interpolation to each household type's demand & integrate to compute welfare.

After accounting for admin costs, Hahn and Metcalfe find that the CARE program is net welfare negative. And they do some robustness checks on the elasticity values to show the answer doesn't change. But their linear assumption is doing a lot of work. We explain why in the paper.

To see how important this is, we compute bounds on net welfare under elasticity range restrictions that widen symmetrically around Hahn and Metcalfe's elasticity estimates. We wanted to know how hard it'd be to break the net negative welfare result, so we focused on upper bounds.
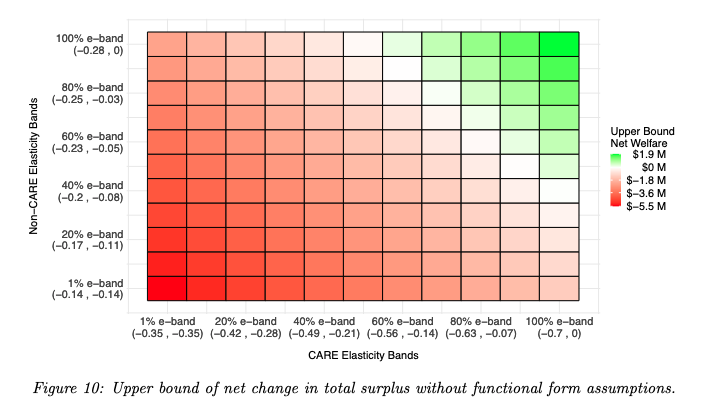
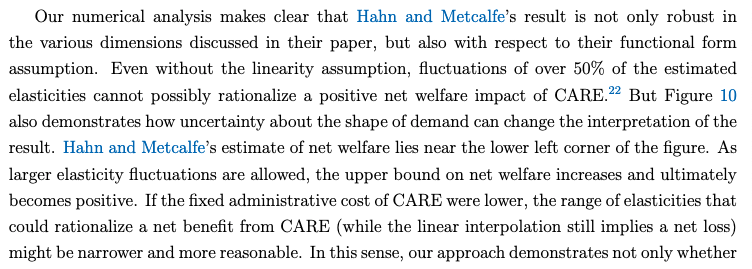
We found that the Hahn and Metcalfe result is pretty robust. Even with no curvature assumptions at all, any reasonable band around the elasticity estimates maintains the qualitative conclusion. But it's not a foregone conclusion. If admin costs were lower, we might be worried.
So! that's the paper in 32 tweets. Caveats apply: our goal for this paper was to study the simplest case. This assumes obs come from the same demand curve (e.g. no mkt shocks). We talk about measurement noise in sec 3.4 but there's more to be done in follow up work. We're on it.
But we learned a lot in writing this paper, and we hope folks will learn some in reading it---and perhaps be inspired to make use of it in their applied work. We're also hoping to roll out a package with code to make it easier, but want to get a better sense of use cases first.
@threadreaderapp unroll
• • •
Missing some Tweet in this thread? You can try to
force a refresh