Trevor Bedford Profile picture
Jan 20 9 tweets 4 min read
Case counts for the US appear to have peaked at a 7-day average of 806k on Jan 14. Omicron grew from approximately 35k daily cases on Dec 14 to ~800k daily cases in ~4 weeks. 1/9
Looking at cases per 100k population per day across states, downturns are clear in NY, NJ, MA, FL, etc..., but many states are not yet at peak case loads. 2/9
If we partition @CDCgov cases between Delta and Omicron using @GISAID sequence data following approach by @marlinfiggins (bedford.io/papers/figgins…) we can see clear Omicron epidemics. 3/9
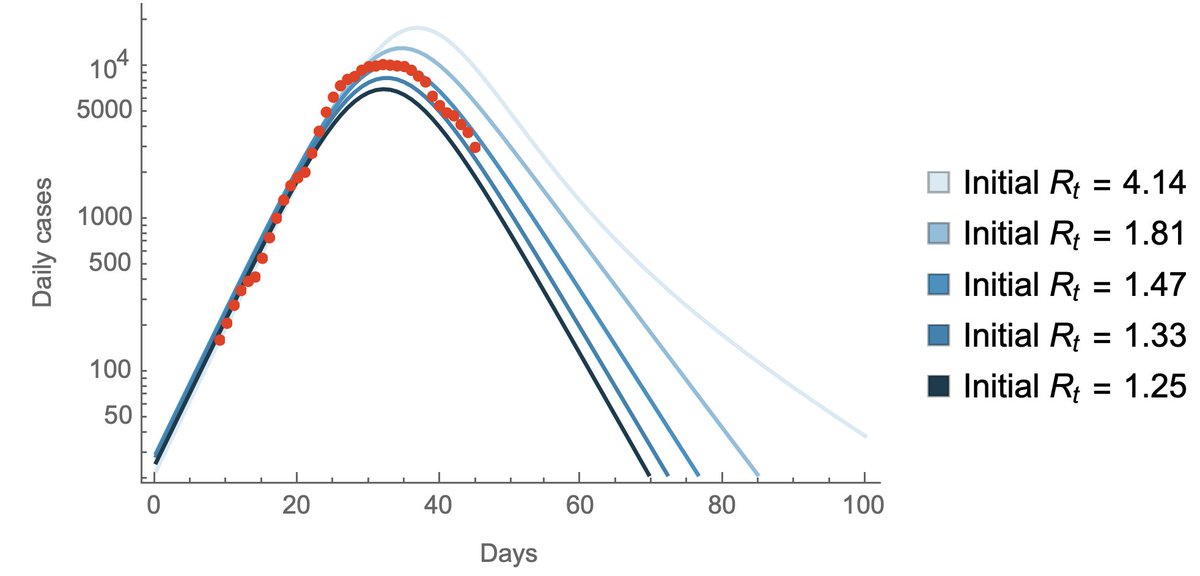
These epidemics have proceeded in a similar fashion across states with initial rapid exponential growth that slowed as epidemics grew in size. It appears that states are largely on the same curve, just some are farther ahead on this curve compared to others. 4/9
We estimate that as of Jan 17 the US as whole has had a cumulative ~15M confirmed cases of Omicron, or approximately 4.5% of the population recorded as confirmed cases. The large majority (>90%) of these accumulated since Dec 14. 5/9
Assuming between a 1 in 4 and 1 in 5 case reporting rate suggests that between 18% and 23% of the country was infected by Omicron by Jan 17, with the large majority infected in a span of just ~4 weeks. 6/9
There may be a longer tail of circulation after the peak (as seen in South Africa), but a rough expectation would have an equivalent number of cases in the next 4 weeks on the other side of the peak. This would suggest 36-46% of the US infected by Omicron by mid-Feb. 7/9
Having ~40% of the population infected by a single pathogen in the span of 8 weeks is remarkable and I can't think of an obvious modern precedent. Flu seasons generally have perhaps 10% infected in the span of 16 weeks. 8/9
My big question now is to what extent will Omicron-like emergence events characterize "endemic" circulation of SARS-CoV-2? Given it occurred once, having it occur again would not be at all surprising, but I don't know whether to expect this every year or every ten. 9/9

• • •

Missing some Tweet in this thread? You can try to force a refresh
 

Keep Current with Trevor Bedford

Trevor Bedford Profile picture

Stay in touch and get notified when new unrolls are available from this author!

Read all threads

This Thread may be Removed Anytime!

PDF

Twitter may remove this content at anytime! Save it as PDF for later use!

Try unrolling a thread yourself!

how to unroll video
  1. Follow @ThreadReaderApp to mention us!

  2. From a Twitter thread mention us with a keyword "unroll"
@threadreaderapp unroll

Practice here first or read more on our help page!

More from @trvrb

Jan 10
With Omicron, case counts in the US and many other countries have skyrocketed. The US 7-day average is now ~680k cases per day, or 0.2% of the population recorded as confirmed cases each day. 1/15
However, a large fraction of infections, symptomatic and otherwise, don't end up reported as cases due to lack of testing (either the individual doesn't seek testing or testing is desired but not readily found). 2/15
Historically, I have assumed that around 30% of infections in the US are reported as cases. This number was derived from seroprevalence and modeling estimates from sites like (no longer updated) covid19-projections.com. 3/15
Read 15 tweets
Jan 5
The impact of Omicron on case counts in the US is now abundantly obvious with 885k reported cases yesterday alone. Figure using @CDCgov data and showing daily reported cases with 7-day smoothing on log scale. 1/12
We can partition state-level cases between Delta and Omicron using sequence data from @GISAID. This is made possible by 1.6 million genomes from the US from viruses sampled since Oct 15. This remarkable dataset is thanks to a large number of labs throughout the country. 2/12
Genomic data will necessarily be lagged by about 10 days, but we can use modeling framework from @marlinfiggins to project forward variant-specific frequencies and epidemic growth rates to the present. 3/12
Read 13 tweets
Dec 23, 2021
Rapid growth and early crest compared to simple Rt estimate can perhaps be explained by a shortened generation interval. We observe a 2-3 day doubling, but calculating the number of secondary infections requires a generation interval assumption. 8/17
The Norway Christmas party case study by Brandal et al (eurosurveillance.org/content/10.280…) shows a clear 3-day incubation period vs ~4.3 days for Delta and ~5.0 days for other variants (thelancet.com/journals/lanep…). 9/17
Similar values of initial epidemic growth rate r can have different values of Rt based on generation interval and lower Rt results in waves that break with fewer individual's infected. 10/17
Read 14 tweets
Dec 23, 2021
An update on Omicron epidemic dynamics and where we stand today. Exponential growth cannot go on forever, but predicting when a wave will crest ahead of observing slowing in case growth is very difficult. 1/17
That said, we have a fundamental prediction from basic epidemic modeling that epidemics with higher initial Rt (number of secondary infections caused by one infection) should result in larger epidemic waves in terms of total infections. 2/17 Image
Estimates of initial Omicron Rt of ~3.5 suggested the potential for a very large wave in terms of cases, with significantly more cases than Delta wave just based on comparison of initial Rt. 3/17
Read 17 tweets
Dec 20, 2021
I fully agree that the single best action individuals (and governments) can be taking to reduce impact of the Omicron wave is to get booster dose if already vaccinated and to get vaccinated if not. 1/14
However, I absolutely think we need to be moving forward with clinical trials for a possible future swap to an Omicron-specific or bivalent vaccine (nytimes.com/2021/12/20/hea…). 2/14
Given rapid spread there's no possibility of having an Omicron-specific vaccine ahead of the wave, and a booster with the original formulation is shown to produce good neutralization titers against Omicron and largely restore effectiveness against symptomatic disease. 3/14
Read 14 tweets
Dec 17, 2021
The extremely rapid rate of spread of Omicron clearly visible since the beginning of December will now be acutely felt in many geographies as local epidemics amplify to the point of eclipsing Delta circulation. 1/12
Continuing previous methods, if we partition case counts from @OurWorldInData using sequence data from @GISAID and apply a modeling approach from @marlinfiggins we get rapid rises in Omicron cases in South Africa, Denmark, Germany, the UK and the US. 2/12
This corresponds to rates epidemic doubling of between 2.3 days in the UK and 3.3 days in Germany. 3/12
Read 12 tweets

Did Thread Reader help you today?

Support us! We are indie developers!


This site is made by just two indie developers on a laptop doing marketing, support and development! Read more about the story.

Become a Premium Member ($3/month or $30/year) and get exclusive features!

Become Premium

Too expensive? Make a small donation by buying us coffee ($5) or help with server cost ($10)

Donate via Paypal

Or Donate anonymously using crypto!

Ethereum

0xfe58350B80634f60Fa6Dc149a72b4DFbc17D341E copy

Bitcoin

3ATGMxNzCUFzxpMCHL5sWSt4DVtS8UqXpi copy

Thank you for your support!

Follow Us on Twitter!

:(