Update on COVID-19 admissions, occupancy and deaths in English hospitals.
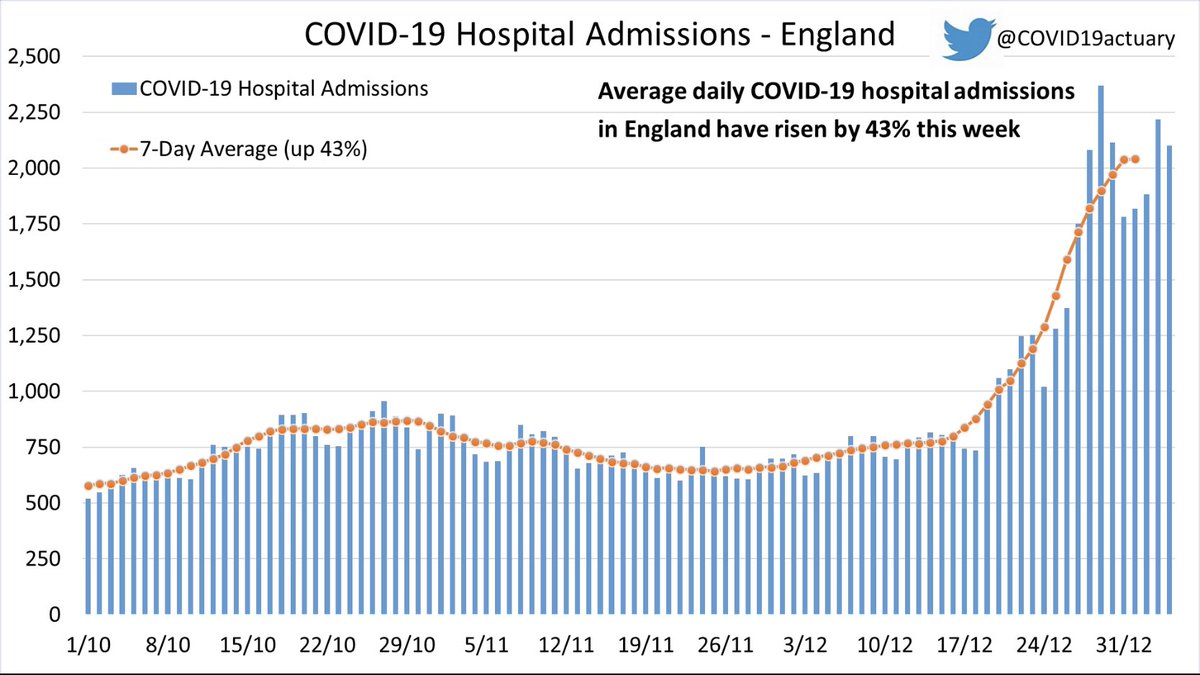
Nationally, admissions with COVID have fallen by 11% week-on-week, with significant falls in every region. Fastest fall in the North West (down 20%) and slowest in the South West (down 6%). 1/4
Nationally, admissions with COVID have fallen by 11% week-on-week, with significant falls in every region. Fastest fall in the North West (down 20%) and slowest in the South West (down 6%). 1/4


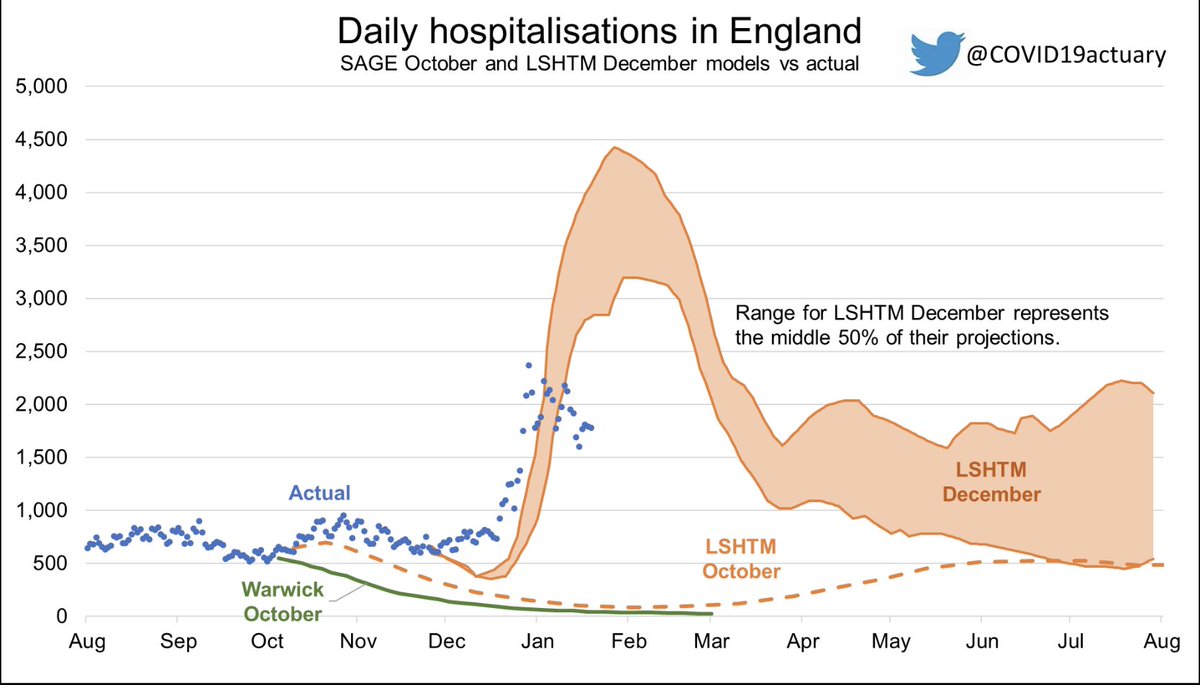
This chart compares actual hospital admissions with modelled scenarios produced by SPI-M-O teams, including an update from @cmmid_lshtm to incorporate Omicron. Assuming no further uptick in admissions the peak will be significantly lower than the central modelled scenarios. 2/4
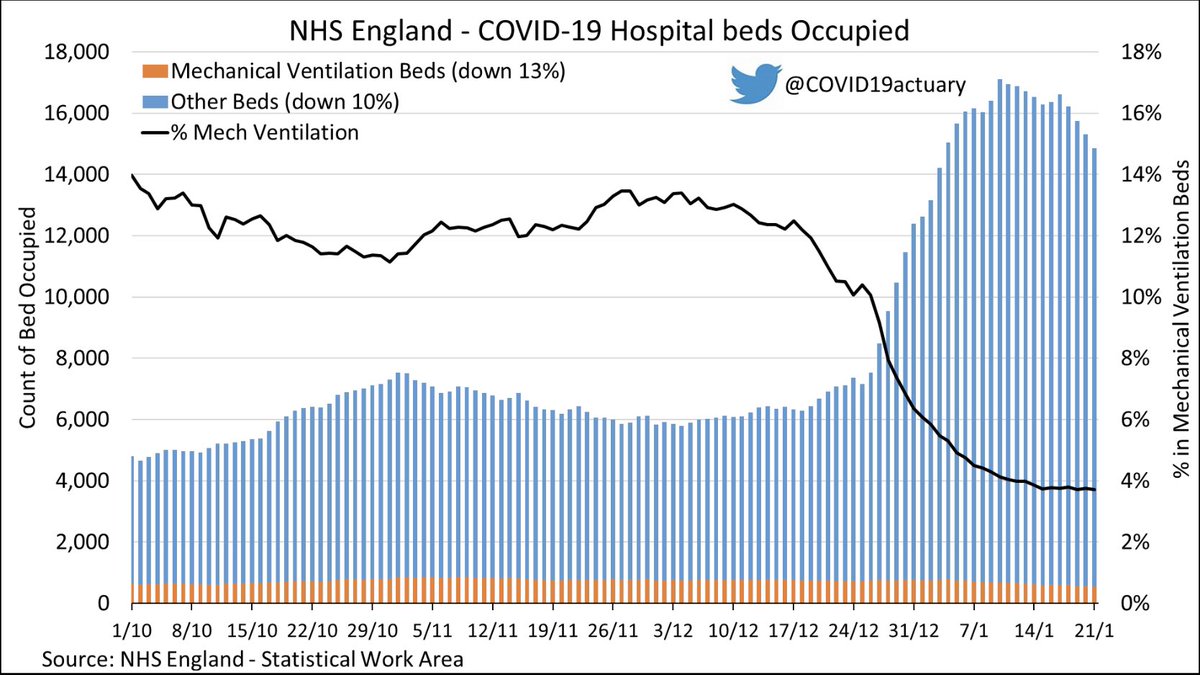
COVID-19 hospital bed occupancy in England is back below 15,000 beds occupied. Mechanical Ventilation bed occupancy is down by 13% week-on-week, while other bed occupancy is down 10%. The proportion of COVID patients in mechanical ventilation beds is the lowest it has been. 3/4
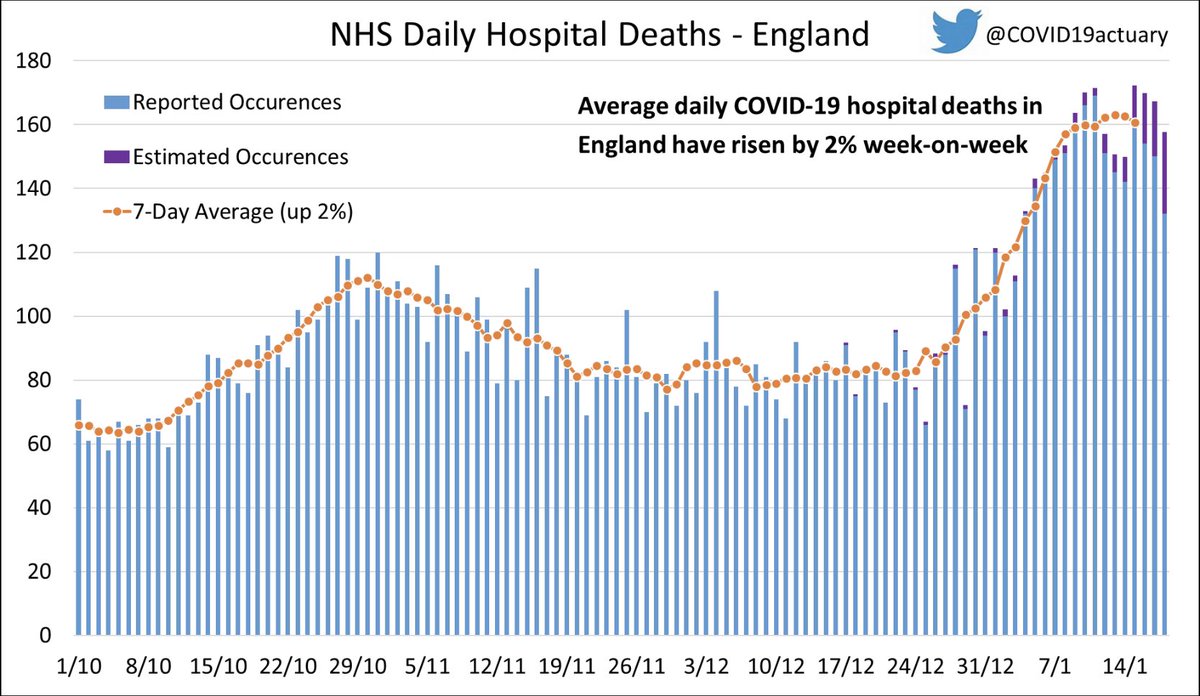
COVID-19 deaths in English hospitals increased by 2% week-on-week but if our modelled reporting delay estimates are accurate then hospital deaths have now peaked.
Purple estimates are based on the pattern of reporting delays in the last two months. 4/4
Purple estimates are based on the pattern of reporting delays in the last two months. 4/4
• • •
Missing some Tweet in this thread? You can try to
force a refresh