New NYT piece out today comparing inflation trends across countries: A key observation is that we in the US got somewhat more heat, but also more growth, jobs resulting in a significantly faster recovery. nytimes.com/2022/01/22/bus…
Also, inflation up strongly in most countries suggests common pressure: COVID/supply chain snarls.
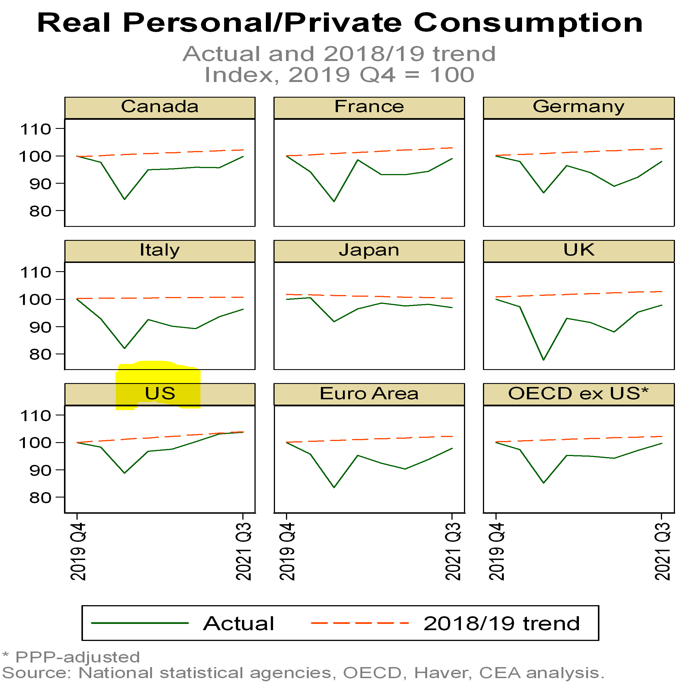
Here’s real GDP and real consumer spending indexed to 2019q4 (cool new figure alert!). As you see, we’re above the pack. Our income supports—go ARP!—have been particularly important in supporting consumer spending (70% of US GDP). We’re the only country back on trend!
That strong US recovery has created price heat. But as NYT noted, a lot of that is the unique US auto situation. Check out this figure on core CPI but without autos.
Why omit cars? Not at all to diminish the challenge these prices engender on families buying new or used vehicle (and @jasonfurman makes fair point). But because auto's price spike clearly function of global chip shortage.
Next, true that euro area has seen less heat than the U.S. over last 2 yrs. But shorter time horizons also instructive, both in understanding the impact of 2021 ARP & in understanding latest trends. Headline inflation similar in the U.S. and Europe, 2nd half this yr.
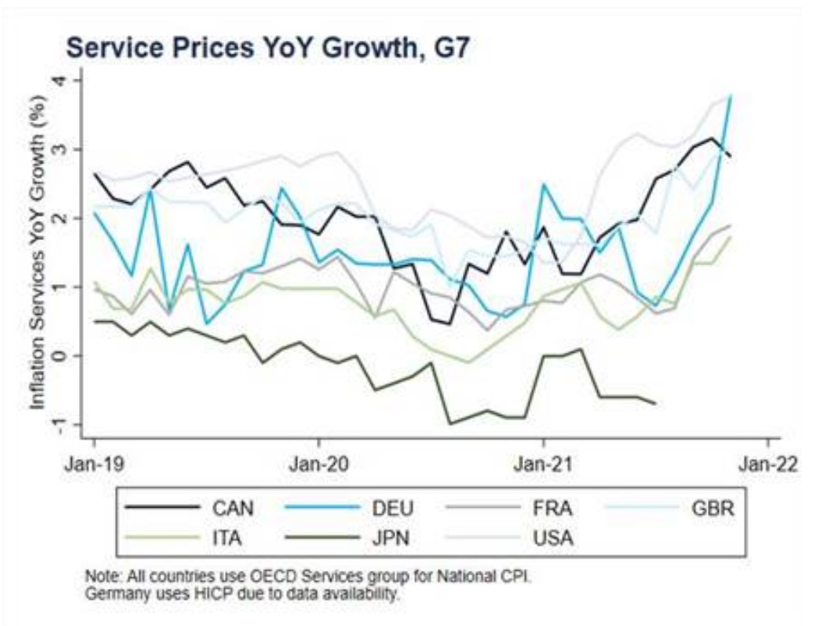
Next, services, unlike cars, are more insulated from global forces, and their price growth is similar across countries. Since policy was different in each country, this too highlights that other factors are important drivers of price pressures.
Bottom line, along w uniquely strong US demand, pandemic-induced supply snarls are juicing price growth in most advanced countries, few of which have seen a recovery as strong as ours. By some measures, US price growth is faster, but we got stronger growth for that extra heat!
• • •
Missing some Tweet in this thread? You can try to
force a refresh
Check out our @WhiteHouseCEA thread on today's GDP report. A touch in the weeds, sure, but that's what we do! Allow me to elaborate this inventories point, as it potentially (important caveat) has outsized importance going forward.
As a change in a change, inventories can be the noisiest part of GDP growth, and we're very careful to recognize that one quarter does not a new trend make. But as our tweet says, it is suggestive of a positive development re supply chains.
IE, it may reflect some degree of supply chain unsnarling as companies better navigate supply chain disruptions to rebuild their inventories and create more buffer.
Great report out today from Moody’s, showing that @POTUS’s BBB proposal for care, climate, education, and more is more-than-fully paid for & boosts GDP, jobs, and the labor force. moodysanalytics.com/-/media/articl…
The report shows how pro-growth policies, like child/elder care boost labor supply, GDP, & jobs. Adding impact of infrastructure bill, Moody's predicts more than 1.5 million more jobs on average, per year across the decade.
Also out today, official scorer (JCT) and US Treasury analyses showing how highly progressive tax changes in BBB raise more than $2t, which MORE THAN OFFSETS the cost of the bill. [Sorry to yell; this seems to not be well understood...] home.treasury.gov/news/featured-…
In recent conversations, I’ve been noodling on different ways to understand the costs and benefits of the $3.5 trillion reconciliation plan. In important ways, this topline number provides the least informative perspective.
First, that’s a gross number. It ignores the impact of “payfors” on the net cost. Over the next decade, that net cost is ZERO (ftr, the gross cost is ~1% of GDP). And those are highly progressive payfors that hit no one under $400K!
2nd, the investment component (as well as the tax cuts) spend out over time. Even if you ignore payfors (and pls don’t do that!), the gross $3.5t spends out over the next decade. EG: In year 1, ARP spent out 63%; in year 1 BBB+infrastructure spends out 6%!
These poverty, inc, and hth ins data are last year's data, so their news window closes quickly, but before that occurs, pls read our thread. There are powerful policy lessons in here, including some relevant to current @POTUS agenda.
Gov't support made a huge difference to economically vulnerable households last year; direct impact checks were particularly potent. Middle-class inc fell last year and poverty rose if you ignore these benefits; the reverse if you include them.
IOW, policy matters and we know how to aggressively and effectively attack poverty and income loss. That old meme--'we fought a war on poverty and poverty won'--is demonstrably false if you account for anti-poverty policy (as does the SPM)!
Just wanted to make sure every saw @ojblanchard1's thread on this "mini-revolution" in how we understand our fiscal situation. This goes way beyond budget wonkery and invokes smarter fiscal policy, myth busting, and even how progress occurs in economics.
The idea is to elevate real debt service to a prominent perch in the analysis of fiscal space. As @ojblanchard1 says, "this is what matters. If we have good uses for debt, such as the various forms of public investment in the Biden plans, this is the time to do it..."