Learn All About ETF Investing for Brighter Future
Thread on Nifty BeES
A Path on Passive Wealth Creation
Retweet And Share !
1/n
Thread on Nifty BeES
A Path on Passive Wealth Creation
Retweet And Share !
1/n
1️⃣Nifty BeES is an ETF (Exchange Traded Fund) by Nippon India, which tracks the Nifty Index.
2️⃣To explain in simpler terms, Nippon India takes your money and uses it to buy the equivalent number of all 50 stocks that the component of Nifty Index.
2/n
2️⃣To explain in simpler terms, Nippon India takes your money and uses it to buy the equivalent number of all 50 stocks that the component of Nifty Index.
2/n
3️⃣ Each single share of Nifty BeES is priced approximately 1/100th of the Nifty Index.
4️⃣If Nifty is at 17000, the price of Nifty BeES would be (about) Rs.170 to 180
So if you buy 1 stock of Nifty BeES, the ETF would have invested in all of the 50 shares in Nifty
3/n
4️⃣If Nifty is at 17000, the price of Nifty BeES would be (about) Rs.170 to 180
So if you buy 1 stock of Nifty BeES, the ETF would have invested in all of the 50 shares in Nifty
3/n
5️⃣But you can say one can’t buy all of the stocks with just Rs.180. Right, but when lakhs of people buy it, the fund can buy enough stocks and your returns will be weighted according to your investment.
6️⃣ Will you return be exactly like Nifty ?
ANS: NO !
4/n
6️⃣ Will you return be exactly like Nifty ?
ANS: NO !
4/n
7️⃣As Nifty bees is traded like stock
All the charges are applied . Nippon Nifty etf has a expense ratio of 0.05%
9️⃣ If you are looking for safe and benchamark returns Nifty etfs are best suited.
1️⃣0️⃣ Etf is better in terms of expense ratio
5/n
Difference Between :
All the charges are applied . Nippon Nifty etf has a expense ratio of 0.05%
9️⃣ If you are looking for safe and benchamark returns Nifty etfs are best suited.
1️⃣0️⃣ Etf is better in terms of expense ratio
5/n
Difference Between :

There Are ETFs for every Category of Stocks Like PSUs , IT , Metals.
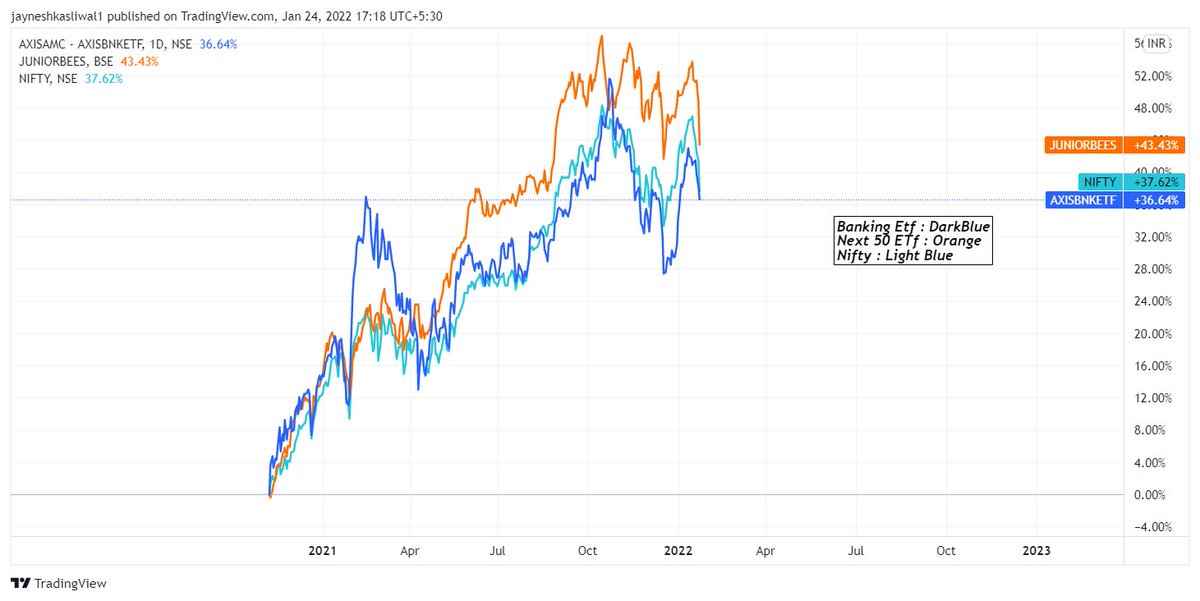
Example : ICICIMIDCAP etf , Nifty Next 50 Etf ( Juniour BeEs).
The volatility is less and this is called passive investing.
One Can start SIP with as low as 100 Rs
6/n
Example : ICICIMIDCAP etf , Nifty Next 50 Etf ( Juniour BeEs).
The volatility is less and this is called passive investing.
One Can start SIP with as low as 100 Rs
6/n

• • •
Missing some Tweet in this thread? You can try to
force a refresh


