
Daily update on Canadian death projections, checking in how many deaths we're likely to see, and which provinces are reporting the expected numbers of new daily deaths
Reported deaths courtesy of the incredible team of Saskatchewan volunteers @covid_canada
This is up to Jan 25
Reported deaths courtesy of the incredible team of Saskatchewan volunteers @covid_canada
This is up to Jan 25

@covid_canada I'm just heading into a meeting, but will be back in 30 min to talk about each graph/province individually.
TLDR look at Quebec and how closely expected and reported new daily deaths are matching.
Watch QC.... It's likely the most accurate death data in the country.
TLDR look at Quebec and how closely expected and reported new daily deaths are matching.
Watch QC.... It's likely the most accurate death data in the country.
@covid_canada If you have questions about how all of this is done, you can go to the thread pinned to my profile for answers to most questions I receive about this.
@covid_canada But basically, it's the predicted new daily deaths for Omicron, based on age-specific mortality rates, vaccination rates, boosters, vaccine protection against death due to Omicron, how many people in each age group live in a region, minus deaths reported so far in each region.
@covid_canada This is all updated daily BTW. You can find the estimates of future deaths, hospitalizations, ICU admissions here: docs.google.com/spreadsheets/d…
Estimated actual cases are average from IHME and ICL.
Those estimated actual cases are multiplied by the characteristic global infection fatality rate for each province, calculated from all the variables above.
Those estimated actual cases are multiplied by the characteristic global infection fatality rate for each province, calculated from all the variables above.
Is it working?
To assess this, let's compare the expected (predicted) new daily deaths in Quebec over time to the number of new daily deaths that were actually reported (7 day rolling averages).
In QC, which has fastest, most complete C19 death reporting in country, you betcha.
To assess this, let's compare the expected (predicted) new daily deaths in Quebec over time to the number of new daily deaths that were actually reported (7 day rolling averages).
In QC, which has fastest, most complete C19 death reporting in country, you betcha.

How well is it working for Canada as a whole?
To answer this, you need to know that as a country Canada misses/does not report about 40% of all COVID deaths. This is all outside Quebec, which is only province that has reported reasonably adequately throughout the epidemic.
To answer this, you need to know that as a country Canada misses/does not report about 40% of all COVID deaths. This is all outside Quebec, which is only province that has reported reasonably adequately throughout the epidemic.

In this graph, the expected new daily deaths for Canada are shown by the blue dashed line.
If you divide those numbers by 1.4 you get the red line.
The black solid line is the actual reported deaths.
Which line does the black solid line match, and what does this suggest?
If you divide those numbers by 1.4 you get the red line.
The black solid line is the actual reported deaths.
Which line does the black solid line match, and what does this suggest?
OK, so up to Jan 25, the expected number of new daily deaths in Quebec is matching reported new daily deaths really closely (at least so far).
The expected REPORTED new daily deaths for Canada (1.4X less than actual expected new daily deaths) also matches really well.
The expected REPORTED new daily deaths for Canada (1.4X less than actual expected new daily deaths) also matches really well.
Let's look at individual provinces.
First, Ontario, oh Ontario, which should have been reporting the same number of new daily deaths as QC since December 15, and which right now should be reporting more new daily deaths than QC.
Here's what ON is reporting compared to expected.
First, Ontario, oh Ontario, which should have been reporting the same number of new daily deaths as QC since December 15, and which right now should be reporting more new daily deaths than QC.
Here's what ON is reporting compared to expected.

heading to another meeting. back soon.
Ontario has historically reported somewhere between 50-60% of expected COVID deaths. We're seeing the gap between expected reported open up as the expected new daily deaths get higher.
We'll see where things are over time. ON is slow at COVID death reporting so *might* catch up.
We'll see where things are over time. ON is slow at COVID death reporting so *might* catch up.

Nova Scotia.
Historically (to end 2020) in Nova Scotia reported COVID deaths account for about half of excess mortality in that province but both excess mortality and reported COVID deaths in the province were so low in 2020 that that estimate is a lot more tentative than for ON
Historically (to end 2020) in Nova Scotia reported COVID deaths account for about half of excess mortality in that province but both excess mortality and reported COVID deaths in the province were so low in 2020 that that estimate is a lot more tentative than for ON

New daily reported deaths in Nova Scotia are still about 50% of expected new daily deaths, but the reported line is bouncy because until this week fewer than 2 new deaths/day were expected. I'd still wait this one out a bit to be sure, but it does look a little low for now.

Manitoba
Historically, MB has come second after Quebec in identifying/reporting most of its COVID deaths, likely partly because both provinces do post-mortem testing. I actually don't know if MB still does it.
MB's reported curve is considerably lower than expected now.
Historically, MB has come second after Quebec in identifying/reporting most of its COVID deaths, likely partly because both provinces do post-mortem testing. I actually don't know if MB still does it.
MB's reported curve is considerably lower than expected now.

But, MB is also projected to have an earlier death peak than many provinces, and I'm not sure if this is off, or if perhaps MB death reporting could be quite far behind. Things are pretty rough in the province right now.
We'll have to follow this one longer to see what happens.
We'll have to follow this one longer to see what happens.
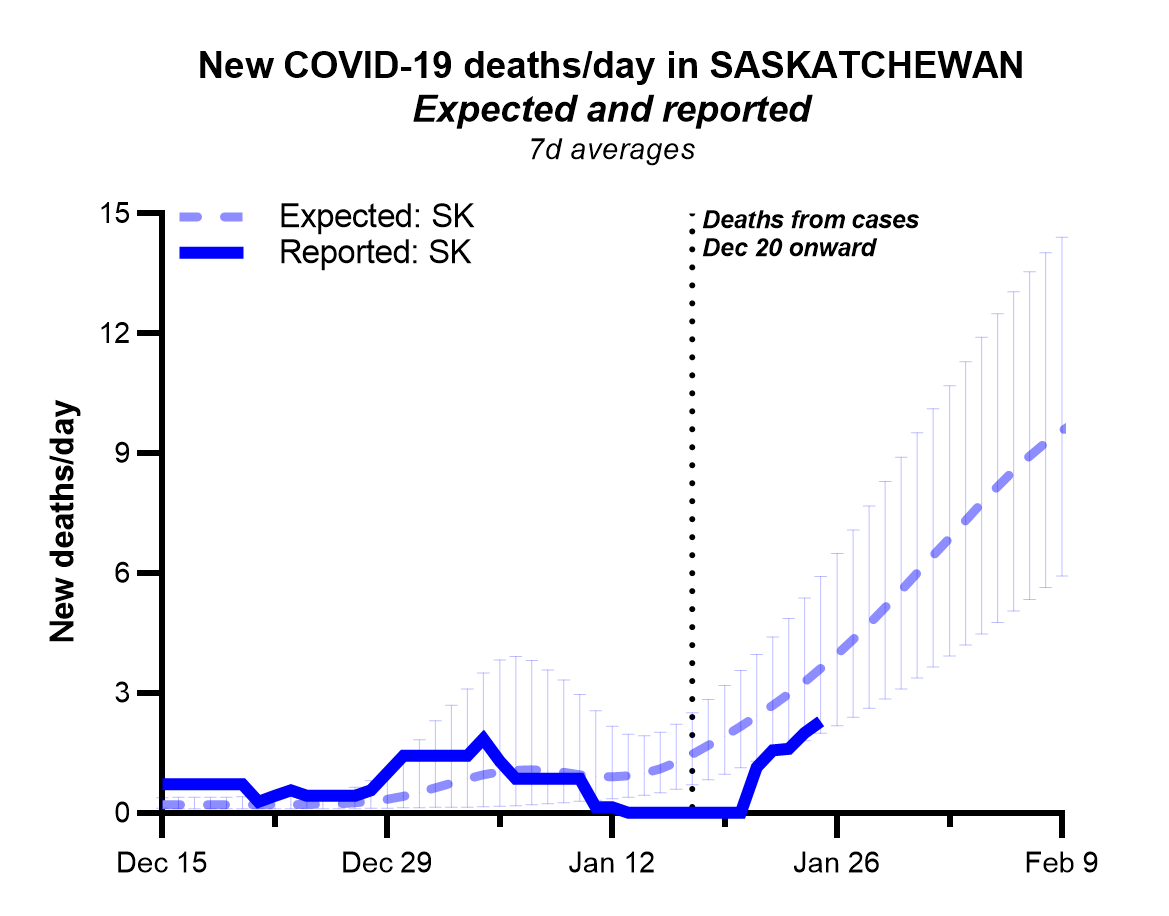
Saskatchewan
Despite the kerfuffle over recent days, what I can say is that right now it looks like new reported SK deaths are in the 50-75% expected range.
And the expected new daily death numbers are small compared to ON, for example, so I'd expect some bounce.
Despite the kerfuffle over recent days, what I can say is that right now it looks like new reported SK deaths are in the 50-75% expected range.
And the expected new daily death numbers are small compared to ON, for example, so I'd expect some bounce.
For provinces like Saskatchewan and Nova Scotia at some point I'll start plotting cumulative expected deaths, which makes it easier to see the differences as they add up. But maybe not till this weekend :)
Alberta
Historically, AB under-detects/under-reports about the same as Ontario, and we'll see what happens, but until recently expected and reported were pretty close to each other.
Time will tell.
Historically, AB under-detects/under-reports about the same as Ontario, and we'll see what happens, but until recently expected and reported were pretty close to each other.
Time will tell.

And, then, of course, there is British Columbia, where the difference between expected and reported is...profound.
For a while I thought maybe it was delayed reporting, but comparing curve trajectories, I think we're seeing possible 5-fold under-detection/under-reporting.
For a while I thought maybe it was delayed reporting, but comparing curve trajectories, I think we're seeing possible 5-fold under-detection/under-reporting.

At this point, BC is by far the most serious concern for disparity between expected and reported deaths.
For shear number of potentially missed deaths, it's Ontario, as always, because of the province size. 25-50% under-detection/under-reporting in ON is a LOT of missed deaths.
For shear number of potentially missed deaths, it's Ontario, as always, because of the province size. 25-50% under-detection/under-reporting in ON is a LOT of missed deaths.
Signing out and heading back to other work. Will check in later.
• • •
Missing some Tweet in this thread? You can try to
force a refresh


