If the right to fly was equally divided among everyone, this would give us 0.6 flights per year.
Of course it is not. In fact, only very few people flies.
10 countries account for 60% of all flights, with the UK, the US, China, Germany, and France alone representing 33% of all flyers.
In England, half of people never flies, and out of the people who do, most of them fly once a year. But when looking at flights, only 20% of them are taken by these majority who flies only once a year. Most flights are taken by people who fly several times.
The richer you are, the more you spend on flying.
The top 20% richest households account for 52% of total expenditure on air travel in the EU.
The richer you get, the more planes you take, and this regardless of nationality.
Take-home message: aviation remains a luxury service, and we should take inequalities into account when we discuss the (necessary) degrowth of that sector.
Close to half of all emissions since the industrial revolution have been produced since 1990, the year of the first report by the Intergovernmental Panel on Climate Change (IPCC).
At current global emissions rates, the 1.5°C budget will be depleted in 6 years and the 2°C budget in 18 years. The per capita sustainable budget compatible with the 1.5°C limit is 1.1 tonne of CO2 per annum per person, i.e. about 6 times less than the current global average.
A study by @jasonhickel, Dylan Sullivan, and @huzaifazoom that quantifies drain from the global South through unequal exchange since 1960.
THREAD
In 2017, the most recent year of data, drain through unequal exchange amounted to $2.2 trillion; in other words, it was equivalent to the quantity of Northern commodities that one could buy in that year with $2.2 trillion.
Appropriation via unequal exchange increases (1) when the volume of international trade grows (extensive growth), and (2) when the price gap between North and South widens (extensive growth).
This recent study by @C_Dorninger et al. shows that economic growth in high-income nations occurs at the expense of poorer countries.
THREAD
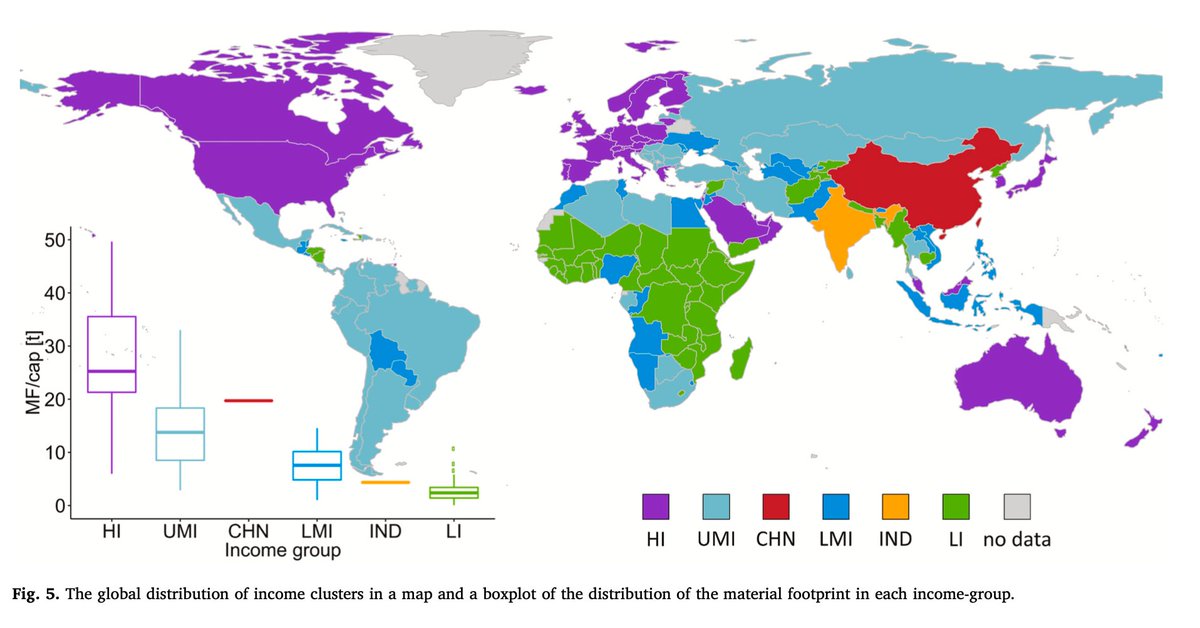
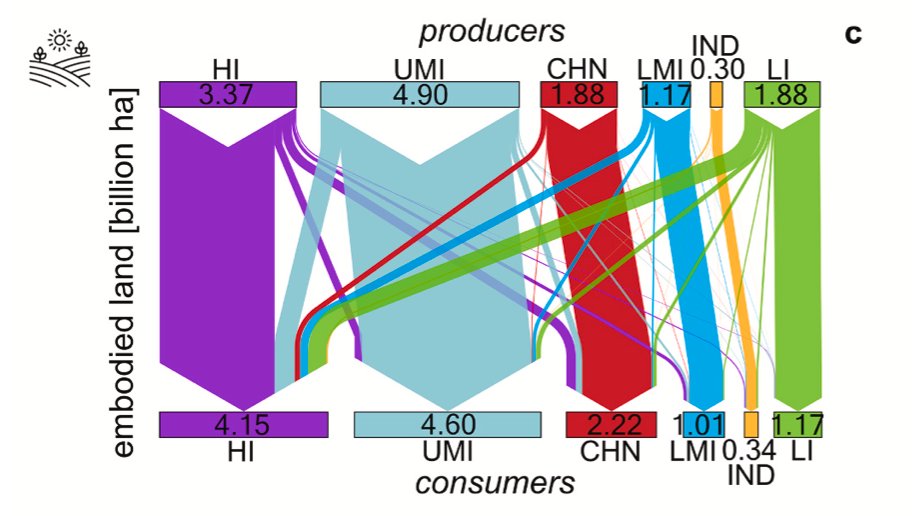
Across the embodied flows of materials, energy, land, and labor, rich countries (in purple) used more resources from a consumption perspective than they provided through production.
For example, high-income countries are the largest net appropriators of land (of approximately 0.8 billion hectares per year). Their land footprint correspond to 31% of total global land used.
This study by @JefimVogel et al. (2021) shows that it is possible to satisfy human needs within a sustainable level of energy use.
THREAD/
1/ Looking at 106 countries, it analyses how the relationship between energy use and need satisfaction varies with a range of socio-economic factors relevant to the provisioning of goods and services.
2/ It looks at 6 human needs and 12 provisioning factors.
If you think inequality is only a matter of income, think again – and check this study on energy inequality by @yl_oswald, @dr_anneowen, and @JKSteinberger.
THREAD/
1/ The richer a country, the bigger its energy footprint.
2/ Failure in economic inclusion causes exclusion from energy provision. Also: when expenditure is highly unequal in a country, the corresponding inequality in energy footprints will tend to be even larger.
Six figures to understand carbon inequality from the World Inequality Report 2022.
THREAD/
1/ Close to half of all emissions are due to one tenth of the global population, and just one hundredth of the world population (77 million individuals) emits about 50% more than the entire bottom half of the population (3.8 billion individuals).
2/ The bottom half of the global population contributed only 16% of the growth in emissions observed since 1990, while the top 1% (77 million individuals) was responsible for 21% of emissions growth.