Started to DCA into $NASDAQ
Why Now?
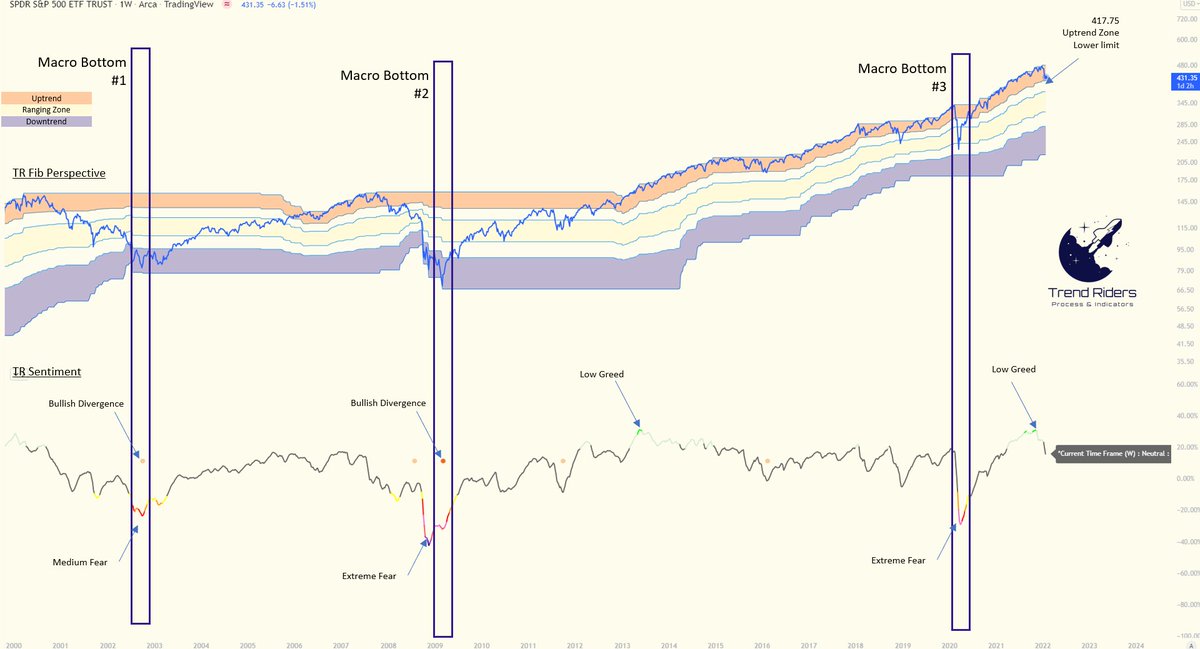
-Since August'08 we have only went from the ranging zone (yellow) to the downtred zone (blue) 4 times.
- Also, we had bounced 2 times from similar current levels in the past d without touching the blue zone.
More 🔽
Why Now?
-Since August'08 we have only went from the ranging zone (yellow) to the downtred zone (blue) 4 times.
- Also, we had bounced 2 times from similar current levels in the past d without touching the blue zone.
More 🔽

The four times we went below:
- 2008-2010: -44% from current level, 722 days to recover.
- 2016:- 8.5% from curent level, 46 days to recover.
-2018-2019: 13% from current levels, 62 days to recover.
- 2020: 13% from current level, 33 days to recover.
- 2008-2010: -44% from current level, 722 days to recover.
- 2016:- 8.5% from curent level, 46 days to recover.
-2018-2019: 13% from current levels, 62 days to recover.
- 2020: 13% from current level, 33 days to recover.
The two times we bounce:
- 2011: TR sentiment was from yellow to pink (neutral to medium fear)
-2015: TR sentimen was from yellow to red (neutral to low fear)
Right now we are at a yellow TR sent. (neutral)
(more about our MBI model in this thread)
- 2011: TR sentiment was from yellow to pink (neutral to medium fear)
-2015: TR sentimen was from yellow to red (neutral to low fear)
Right now we are at a yellow TR sent. (neutral)
(more about our MBI model in this thread)
https://twitter.com/WalterCripto/status/1486452275295965186?s=20&t=olfn7oVyKFCdVM41eex-mw
So as you can see, the bottom is very unpredictable, we could go all the way down to the blue zone or bounce from here. But the market always recovers eventually.
Also TR sentiment is already on yellow, so I won't try to predict the bottom and just start DCA now.
Also TR sentiment is already on yellow, so I won't try to predict the bottom and just start DCA now.
Also if TR sentiment intensifies into fear levels I will just increse my DCA ammount.
What is DCA? check our basic learning material thread.
What is DCA? check our basic learning material thread.
Please note that this is LONG TERM trade, will follow this strategy for months/years if needed. Only with a part of my total portfolio.
Want to be consistently updated and access our custom indicators? Join our Patreon
- Newsletter
- Trend System (TS) Access and Indicators
- Max Bottom Identifier (MBI) Access
- Crypto tracker (Updated Trends of major coins)
patreon.com/Trendriders
- Newsletter
- Trend System (TS) Access and Indicators
- Max Bottom Identifier (MBI) Access
- Crypto tracker (Updated Trends of major coins)
patreon.com/Trendriders
#stocks #Crypto
@TechDev_52 @crypto_birb @ctoLarsson @intocryptoverse @BigCheds @invest_answers This longterm perspective on $NASDAQ may interest you. Same principles can be applied to $BTC.
@TechDev_52 @crypto_birb @ctoLarsson @intocryptoverse @BigCheds @invest_answers This longterm perspective on $NASDAQ may interest you. Same principles can be applied to $BTC.
• • •
Missing some Tweet in this thread? You can try to
force a refresh


