Public Health Scotland - covid data
Booster proportion continues to rise rapidly - a higher proportion of cases, hospital admissions and ‘covid deaths’ than the proportion of the population
Maybe #TheDrugsDontWork ?
Booster proportion continues to rise rapidly - a higher proportion of cases, hospital admissions and ‘covid deaths’ than the proportion of the population
Maybe #TheDrugsDontWork ?

“But we have to look at population"
Okay, same data by rate. Compared to unvacinated, booster is
- 30% more likely to ‘catch covid’ (test positive)
- 20% less likely to be hospitalised
- but 70% more likely to be a covid death
Okay, same data by rate. Compared to unvacinated, booster is
- 30% more likely to ‘catch covid’ (test positive)
- 20% less likely to be hospitalised
- but 70% more likely to be a covid death

“But we have to consider different ages!"
Okay, age-standardised. Firstly, case risk. These are 95% confidence ranges, so the correct answer is ‘probably’ in the shaded range.
Both boosted and two-dose are more likely to catch covid (test positive) than unvaccinated. 🤔
Okay, age-standardised. Firstly, case risk. These are 95% confidence ranges, so the correct answer is ‘probably’ in the shaded range.
Both boosted and two-dose are more likely to catch covid (test positive) than unvaccinated. 🤔

These are the hospitalisation rates.
Here we see where counting Boosted as ‘Two dose’ pushes any resulting hospitalisations into the two-dose category. Where that was previously low and stable, risk suddenly shows rocketing up.
‘Bayesian Datacrime'
boriquagato.substack.com/p/new-data-on-…
Here we see where counting Boosted as ‘Two dose’ pushes any resulting hospitalisations into the two-dose category. Where that was previously low and stable, risk suddenly shows rocketing up.
‘Bayesian Datacrime'
boriquagato.substack.com/p/new-data-on-…

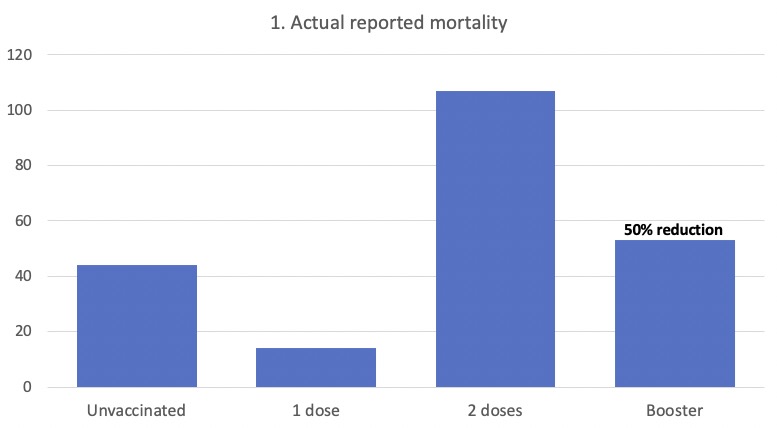
Finally mortality rates by ASMR. Same problem, the activity of ‘Boosting’ appears to be creating problems, which are counted into the two-dose and disrupting the risk. Two dose showing probably worse than unvaccinated
‘Bayesian Datacrime'
boriquagato.substack.com/p/new-data-on-…
‘Bayesian Datacrime'
boriquagato.substack.com/p/new-data-on-…

Over time these data will settle. Boosters no longer contaminate two-dose data, Booster range will settle and look like… whoop, ‘waning protection’! Another dose needed!
Rinse & repeat.
Or see that all-cause is back below normal (after autumn spike), and this was over months ago
Rinse & repeat.
Or see that all-cause is back below normal (after autumn spike), and this was over months ago
• • •
Missing some Tweet in this thread? You can try to
force a refresh


