Climate change is a huge challenge that is impacting us today, and gets worse every year our emissions remain above zero.
But way we talk about climate impacts can at times counterproductive and disempowering. Climate is, ultimately, more of a matter of degrees than thresholds.
The world has warmed by 1.2C since the late 1800s, and will very likely pass 1.5C in the 2030s. A 1.5C world is one of notably worse impacts on human and natural systems than today.
But its not a "tipping point" that necessarily results in significant additional warming.
Earth systems that we consider potential tipping elements - ice sheets, permafrost, coral reefs, AMOC, amazon rainforest, among others – respond to changing temperatures spatially and temporally heterogeneously.
That is, few are what we'd think of as a traditional tipping point where a specific threshold results in rapid system change. Rather, they gradually are lost with additional warming – some over fairly long timescales – and are hard to get back once they parts are gone.
Some of these tipping elements – such as permafrost thaw, Amazon rainforest loss, and summer sea ice loss – can contribute to warmer temperatures this century, but the effects are on the scale of tenths of a degree of extra warming vs. scenarios without these effects.
While tipping points get all the attention, most of the impacts of climate change get worse with more warming, and sometimes non-linearly, but may not exhibit irreversibility. Different human and natural systems will have different levels of vulnerability to climate impacts.
So, we can say with some confidence that there are unlikely to be near-term climate tipping points that result in substantial additional warming this century. Rather, 1.5C will be worse than 1.2C, 2C much worse than 1.5C, and 3C much much worse than 2C.
At the same time, we don't understand the climate system perfectly, and Earth's distant past has some large rapid climate shifts. The further we push Earth's climate outside the range its been in for the past few million years (e.g. >2C), the bigger the risk of unknown unknowns.
So when someone tells you that we have X many years to save the planet or we are all doomed, its a framing that is inaccurate and inconsistent with our current scientific understanding. But the longer we wait to reduce emissions, the worse both mean and tail risk impacts become.
• • •
Missing some Tweet in this thread? You can try to
force a refresh
Zero emissions will ultimately require replacing fossil fuels with zero-carbon alternatives. We have mature(ish) tech to get a long way there – perhaps half or two thirds. But we need to prepare for hard-to-decarbonize parts even while we more rapidly deploy what we have today.
Behavior matters too, but its hard to disentangle behavior from technology. For example, having compelling plant alternatives helps people stop eating beef. Better public transport makes it easier to reduce car/flight use, etc. iea.org/articles/do-we…
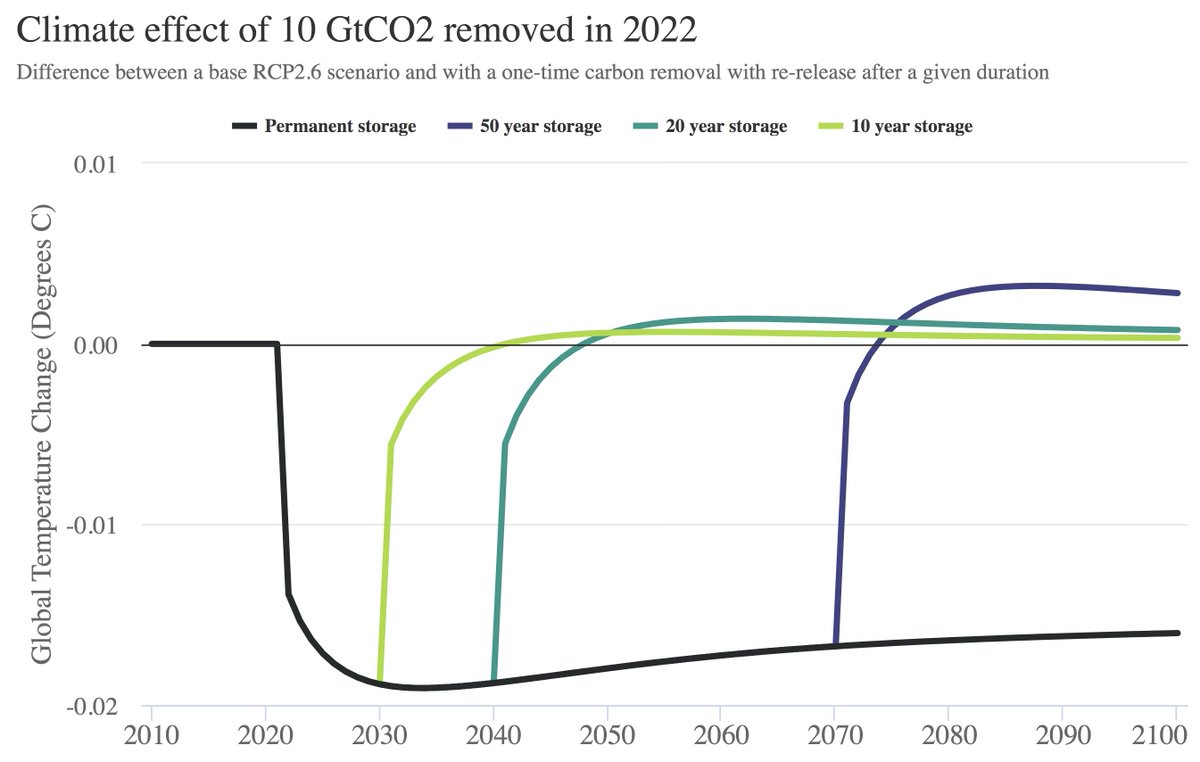
Carbon removal is important, but how long it stays out of the atmosphere makes a big difference on resulting climate impacts. Here are the results of a simple climate model simulating a one-time removal of 10 GtCO2 in 2022, which is stored for 10, 20, 50, or 100+ years:
The figure shows the difference between a deep mitigation scenario (RCP2.6) with and without 10 GtCO2 removed in 2022, which is then re-released after a given period. There are a few interesting dynamics at work here.
Once the CO2 is re-released the climate quickly warms in response, though its buffered a bit by ocean heat uptake times. Somewhat counterintuitively, after re-release we actually end up with more more long term warming than if the CO2 had never been captured in the first place.
Many countries have adopted net-zero commitments later this century. In most cases these apply to all GHGs, not just CO2, and are structured using 100-year global warming potentials (GWP-100).
It turns out this choice effectively commits countries to a lot of carbon removal. 1/
If you add together different GHGs using GWP-100 it does a pretty poor job of simulating actual warming. It conflates flow pollutants (like CH4) with stock pollutants (like CO2) in ways that are unhelpful, as I discussed last year in this thread:
While we can get close to zero CO2 emissions (at least in theory), it will be much harder to remove all the CH4 and N2O emissions from agriculture. This means that a zero-GHG target is actually a negative-CO2 target, where CO2 removal is balancing out remaining CH4 and N2O.
⬆ 5th or 6th highest surface temps
⬆ Warmest summer on land
⬆ Warmest year for 25 countries + 1.8 billion people
⬆ Record ocean heat
⬆ Record high GHGs
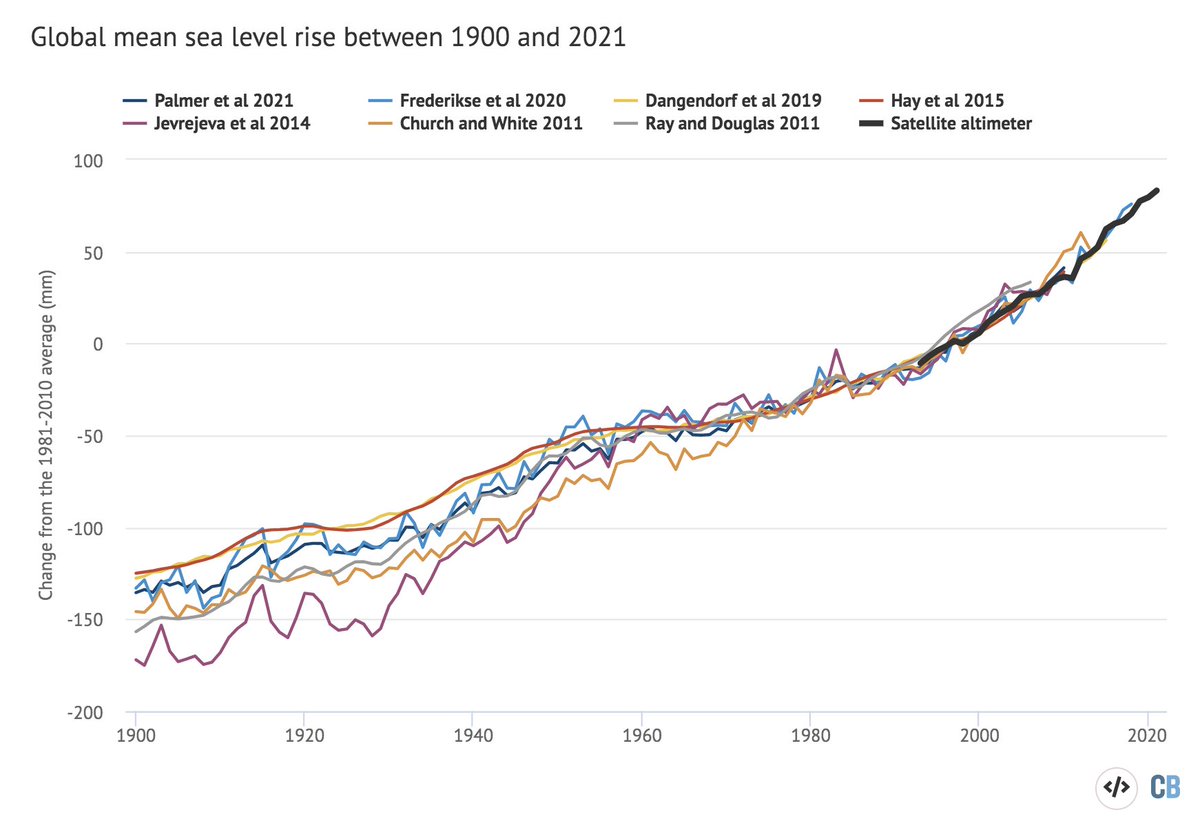
⬆ Record high sea levels
⬇ Record low glacier mass
1/18
2021 was a bit cooler than the last few years due to a moderate La Nina event. La Nina tends to result in cooler temps globally, though the global response tends to lag 3-4 months after peak conditions. Here is what global temps look like since 1970 with and without ENSO removed:
The Tonga eruption yesterday appears to be one of the largest volcanic events we have seen in decades.
We do not know how much cooling SO2 it has put in the stratosphere (data will come in later today), but this is the effect a Pinatubo-sized volcano would have on temps today:
That being said, we have no particular reason to think that this eruption will be Pinatubo-sized in terms of its stratospheric SO2 injection. That will depend on how much SO2 was released for how long how high in the stratosphere. We will know more in a day, so watch this space!
Scientists get excited about these sort of events because they can serve as natural climate experiments, but we should not lose sight of the real suffering on the ground that this event (and the resulting tsunami) have caused for people in Tonga and the surrounding regions.
Ocean heat content is our best measure of the impact of human activity on the climate; >90% of all heat trapped by greenhouse gases is absorbed by the oceans.
In 2021, we saw the warmest ocean heat content since records began, >400 billion trillion joules higher than the 1940s.
This is from the newly released dataset by @Lijing_Cheng and the Institute for Atmospheric Physics, though NOAA's ocean heat content record shows similar results: link.springer.com/article/10.100…
For more details on surface and atmospheric temperatures, ocean heat, sea level rise, atmospheric GHGs, sea ice, and other climate indicators in 2021 see our @CarbonBrief state of the climate analysis coming out in the next few days.