Been a while since I did a DD thread. Let's talk about $AMC this time.
My thesis: Moon Soon. 🦍🤝💪🚀🌕
This is a long one. Fuckle the Buck up.
My thesis: Moon Soon. 🦍🤝💪🚀🌕
This is a long one. Fuckle the Buck up.

So the biggest observation I've made in my Short Exempt Squeeze Signal Theory, to date, has been that massive incoming short exempts (SEs) while the price is rising out of market maker's (MMs) control.
For those in need of a refresher, Short Exempts (SEs) are shorts which are exempt from REGSHO's Uptick Rule while a stock is on the REGSHO Short Sale Restriction (SSR) list.
SEs are also exempt from the locate rule.
SEs are ONLY allowed during "Bona-fide Market Making Activity"
SEs are also exempt from the locate rule.
SEs are ONLY allowed during "Bona-fide Market Making Activity"
In practice, SEs are a utility for MMs to control the price by taking shorts without locating a borrowed share, which they have T+6 days to return before they Fail-to-Deliver (FTD).
If they successfully cause the price to tank during this time, they can easily cover the FTDs...
If they successfully cause the price to tank during this time, they can easily cover the FTDs...
But if the price does NOT drop, and in fact, goes up during this activity, MMs are forced to cover those shares (not always legitimately) by borrowing or buying stock from the market and delivering the shares to be prevented from being restricted from market-making on that stock.
Refresher over....
What I've observed in my theory is that a massive SE increase versus daily short volume (SV). This is called the Short-Exempt Ratio (SER)) is heavily correlated to a spike in FTDs and a subsequent price move, sometimes resulting in a squeeze.
SER = (SE / SV)
What I've observed in my theory is that a massive SE increase versus daily short volume (SV). This is called the Short-Exempt Ratio (SER)) is heavily correlated to a spike in FTDs and a subsequent price move, sometimes resulting in a squeeze.
SER = (SE / SV)
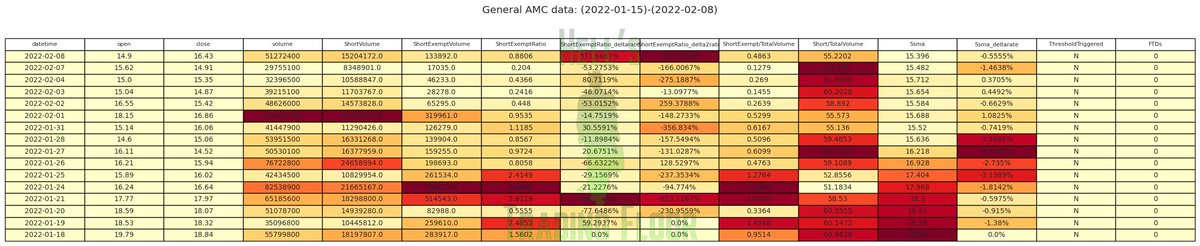
Let's take note from May-June on AMC leading up to the big squeeze. Courtesy of the #HellsTradingFloor ScourgeBot which highlights huge correlations in price moves (via the 5-day Moving Average (MA5)).
Huge Anomalies are highlighted in increasingly darker shades of red
Huge Anomalies are highlighted in increasingly darker shades of red


Although it looks like a bloody mess, that table/chart describes a HUGE correlation between anomalies in Short Exempts and the massive moves in $AMC that occurred in Late May / Early June 2021.
What we've been missing was CHART EVIDENCE to prove/identify it for a trading signal!
What we've been missing was CHART EVIDENCE to prove/identify it for a trading signal!
Well guess what apes and apettes? We have one.
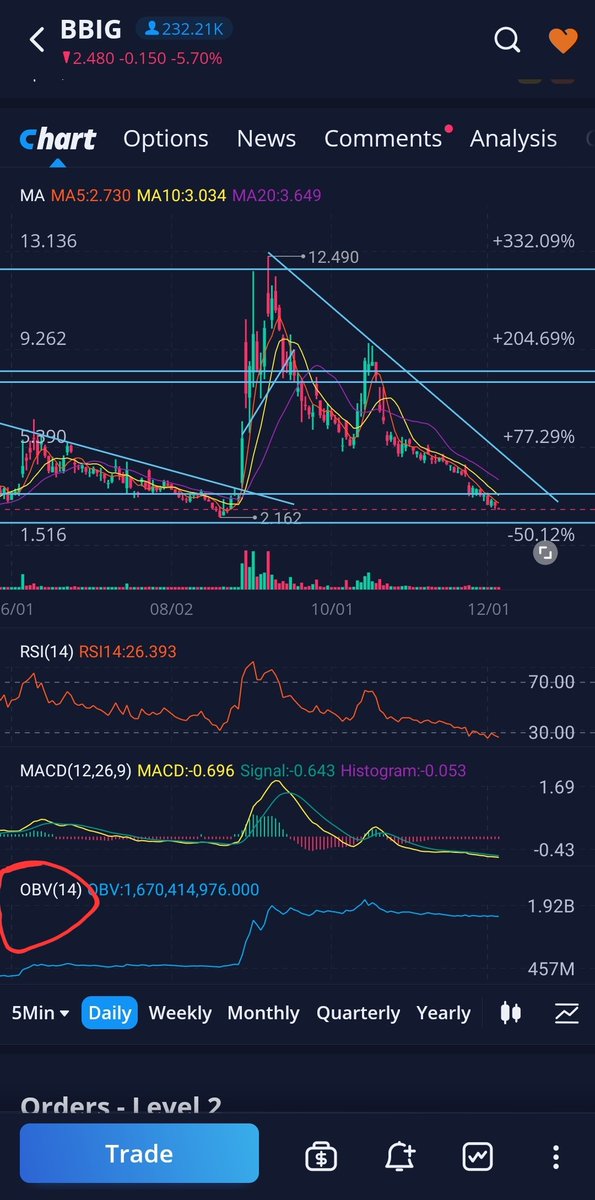
Note this chart during $AMC's squeeze and the early warning signals with the OBV breaking down then rebounding in < 2 trading weeks.
Also note the OBV skyrocketed a full week before AMC went from $3 to $20. 😈
Note this chart during $AMC's squeeze and the early warning signals with the OBV breaking down then rebounding in < 2 trading weeks.
Also note the OBV skyrocketed a full week before AMC went from $3 to $20. 😈

Let's try again... $AMC's second squeeze cycle... Funny, that OBV pattern looks awfully familiar.

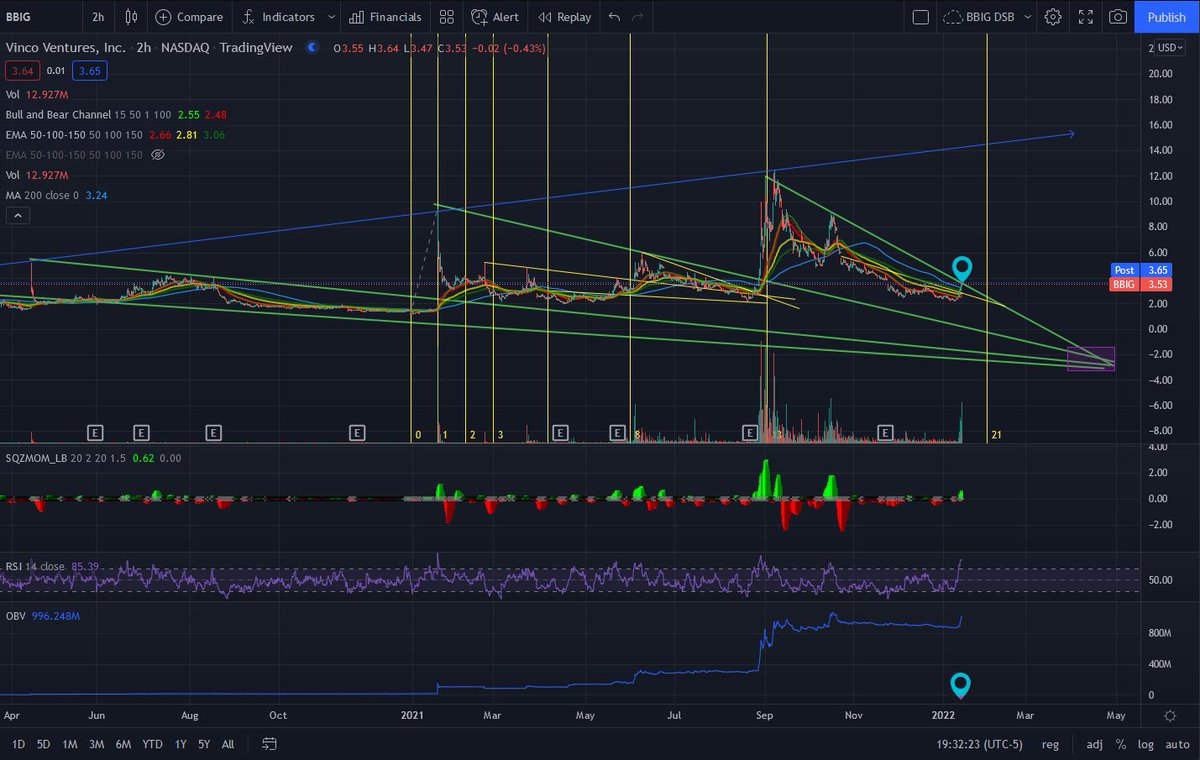
And what about now? $AMC
Well, we haven't squeezed yet... but we see a pretty familiar pattern here, don't we? 😜
The key here is identifying the falling wedge within the bull channel and seeing that we're about to have a breakout that could lead to a major run.
Well, we haven't squeezed yet... but we see a pretty familiar pattern here, don't we? 😜
The key here is identifying the falling wedge within the bull channel and seeing that we're about to have a breakout that could lead to a major run.

You also might be asking yourself "What's with those little horizontal bars below the price chart?" I've been saving the best part for last.
Those are timeline bars.
I've been tracking $AMC's squeeze timelines, and I noticed a pattern between them all.
Those are timeline bars.
I've been tracking $AMC's squeeze timelines, and I noticed a pattern between them all.

Each timeline (Yellow bar) starts at the most recent peak of $AMC's price and goes all the way to the next peak.
So 1 yellow bar is the actual peak-to-peak
If we multiply the first yellow bar by 2 and add 1 week, we end up with EXACTLY timeline 2
So 1 yellow bar is the actual peak-to-peak
If we multiply the first yellow bar by 2 and add 1 week, we end up with EXACTLY timeline 2

What I'm drawing from this speculation is that there are algorithms which are working on $AMC to drive its price down, but it leaves behind footprints in the sand that we can uncover in the form of OBV and by comparing the timelines, showing a clear, repeating pattern.
Some concerns that I need to address on $AMC via the data so kindly provided by #HellsTradingFloor's friends at @ORTEX:
The FTDs have all completely disappeared which have been a major indicator of loss of control, but it was also a tool used against us...
The FTDs have all completely disappeared which have been a major indicator of loss of control, but it was also a tool used against us...

Ergo I have some mixed feelings about the disappearance of the FTDs, and I don't think it's a coincidence that their disappearance coincide with the implementation of DTCC-2021-005 and NSCC-2021-002...two regulations retail heavily demanded but did not, in fact, solve the problem
Next. More than 69M shares have slammed the lending volume records, shattering all previous highs.
That's the little orange bar you see on the far right.
It isn't clear if this means shorts are ready to unleash hell or accumulating shares to short at the top of the squeeze
That's the little orange bar you see on the far right.
It isn't clear if this means shorts are ready to unleash hell or accumulating shares to short at the top of the squeeze

There are still more than 20M shares available to borrow/short according to the Utilization on @ORTEX which I find highly reliable. Utilization is only 82%, but at 20% SI and 109M shares sold short, that's still a massive share count to cover. That's not including naked shorts!

Our Bot has been analyzing the options as well though, and $AMC is showing some serious gamma potential with ~5% of the float open on the call chain above $30 between now and Mar 25.
That's a huge amount of calls to hedge, with the potential to drive more than 25M buying volume.
That's a huge amount of calls to hedge, with the potential to drive more than 25M buying volume.

Let's not forget the roughly 150K puts that are currently ITM with more than 50% of those between $17-25 strike, just 20% rise in price away.
A sudden spike in short exempts today is a telling sign that something may be brewing in $AMC, but #HellsTradingFloor is ready for it.
A sudden spike in short exempts today is a telling sign that something may be brewing in $AMC, but #HellsTradingFloor is ready for it.

This is all I have for you guys for tonight. It's going to be a busy week in the markets. If you want to keep an eye on this information, my Tinfoil Timeline as I'm a calling it can be viewed on TradingView at any time:
tradingview.com/chart/lNcC4yWb/
tradingview.com/chart/lNcC4yWb/
To stay up to date, or to get exposure to some of these tools, DD, TA charting software, analytics, and education we offer at #HellsTradingFloor, consider joining us at discord.gg/hellstradingfl…
As always, none of this is financial advice & neither myself nor the staff at HTF are financial advisors; however, we are here to help educate and share as much knowledge as we can offer.
Remember, patience is 🔑
May the odds be ever in your favor.
See you on the trading floor.
Remember, patience is 🔑
May the odds be ever in your favor.
See you on the trading floor.
P.S. The OBV Crossover we're watching is 5.0 - 5.15Bn shares On Balance. Anything above this is considered extremely bullish, and we'll be targeting Deep OTM calls for 30-45 days til expiration based on that signal.
It's not a secret. Apes and demons are in this together.
It's not a secret. Apes and demons are in this together.

P.P.S... Let's drag some Hedge Funds kicking and screaming all the way to hell.
@threadreaderapp rollup
• • •
Missing some Tweet in this thread? You can try to
force a refresh