Upon closer inspection of the $AMC Share Lending Volume, there is a MASSIVE changing of hands going on here, but the actual trading volume is extremely low.
Further, the number of new shares on loan and returned shares from the day the Utilization maxed to 100% is ~ the same.
Further, the number of new shares on loan and returned shares from the day the Utilization maxed to 100% is ~ the same.

Additionally, several recent anomalies in the Short Exempts activity indicates there was also a notable loss of control on $AMC stock by market makers.
Note the short exempt spike Jan 21-25, and the subsequent volume spike 6 days later (Feb 1). That's interesting.

Note the short exempt spike Jan 21-25, and the subsequent volume spike 6 days later (Feb 1). That's interesting.


This is speculation on my part, but what I believe is happening is a settlement of shares in order to deliver on a massive number of FTDs.
Do you all remember DTCC-2021-005 and NSCC-2021-002? Those two rules had a profound effect on our market because it was meant to end FTDs
Do you all remember DTCC-2021-005 and NSCC-2021-002? Those two rules had a profound effect on our market because it was meant to end FTDs
Specifically, naked shorts were going to be stopped because there would need to be actual shares in the inventory to back up any naked puts/calls which were being used in the form of FLEX Option contracts as "synthetic" shares 

There were ALSO changes to the Supplemental Liquidity Deposit (SLD) requirements for NSCC members which was effective June 23rd.
This required DAILY intraday SLD calculations to prove that members were meeting liquidity margin requirements during ...
reddit.com/r/Superstonk/c…
This required DAILY intraday SLD calculations to prove that members were meeting liquidity margin requirements during ...
reddit.com/r/Superstonk/c…
... monthly options settlement periods.
If there was an assumed liquidity crisis in the works, the NSCC would be pressuring members to post liquidity as collateral for upcoming predicted volatility due to options expirations.
Further, ALL options must be backed with REAL SHARES
If there was an assumed liquidity crisis in the works, the NSCC would be pressuring members to post liquidity as collateral for upcoming predicted volatility due to options expirations.
Further, ALL options must be backed with REAL SHARES
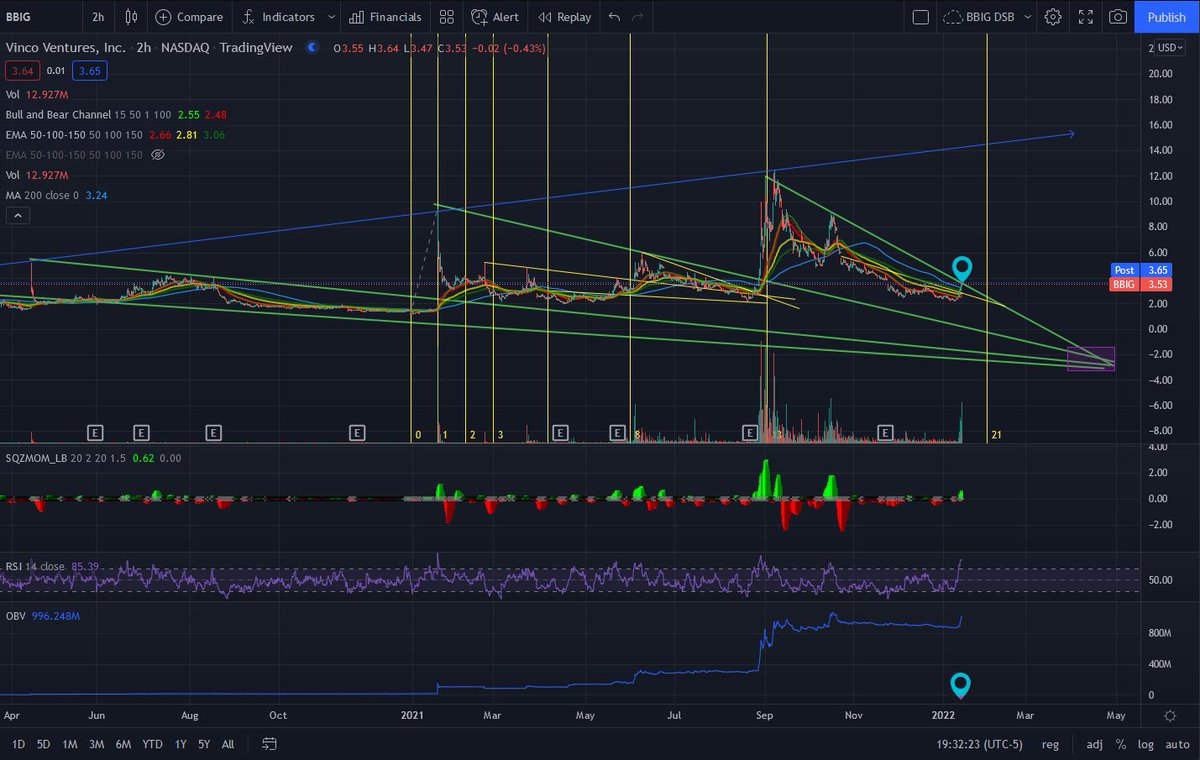
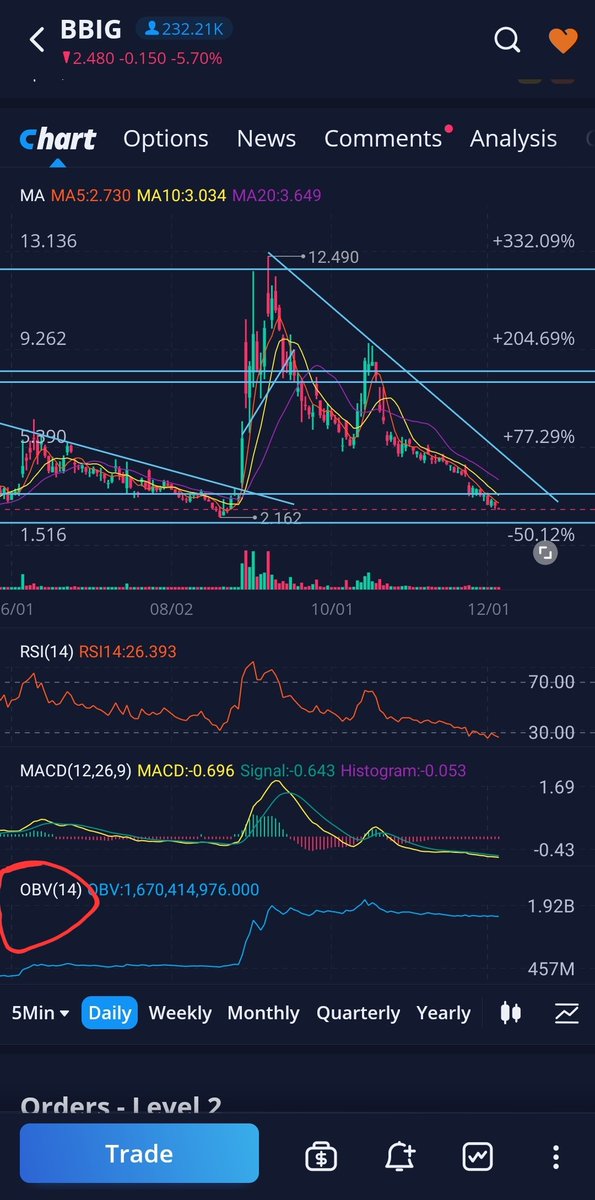
The fact that $AMC, $GME, $PROG, $BBIG, $SENS, $BKKT, $GOTU, $GTLB and MANY other heavily shorted stocks are ALL moving upward together against the overall market downtrend signals that SOMETHING is coming, and I can't pretend I'm not excited as a 6 year old on xmas. 

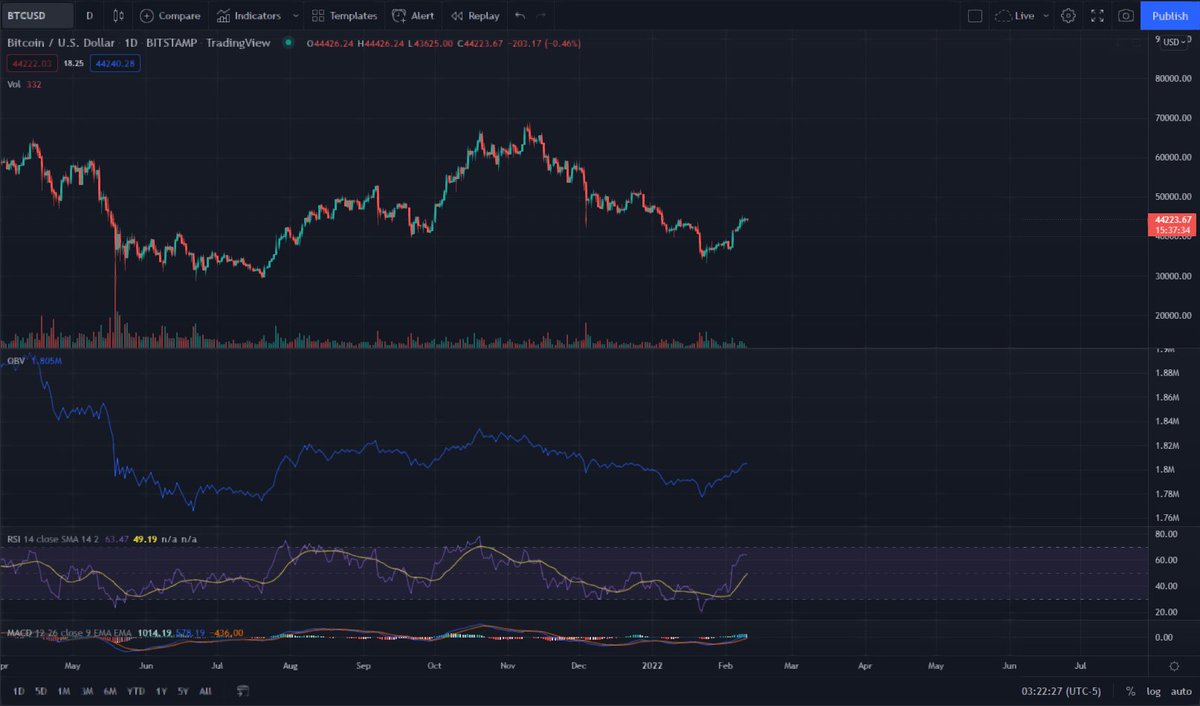
There's also a notable shift into $BTC lately which has been signalling that a crypto surge is coming soon.
All of these can result in major liquidity problems for brokers and market makers, in which case, NSCC supplemental liquidity requirements AND DTCC-2021-005 rules
All of these can result in major liquidity problems for brokers and market makers, in which case, NSCC supplemental liquidity requirements AND DTCC-2021-005 rules

It's also no coincidence that $AMC options expiration is showing some interesting trends as well. 6% of $AMC's free float is on the call chain for $30 strike and above...
That's 33.18M shares that need to be hedged for iif they were to go ITM...

That's 33.18M shares that need to be hedged for iif they were to go ITM...


I'll say that again... 33.18M Shares are on the line if $AMC went to $30 before March 23...
That's PRETTY FUCKING CLOSE to how many "BORROWED" shares just changed hands 2 days ago!
My suspicion? This is a hedge against volatility that they can't stop!

That's PRETTY FUCKING CLOSE to how many "BORROWED" shares just changed hands 2 days ago!
My suspicion? This is a hedge against volatility that they can't stop!


Myself and the other analysts at #HellsTradingFloor will be CLOSELY monitoring the situation, so please consider tuning into our streams for further updates, or perhaps consider joining us at discord.gg/hellstradingfl…
Please note that none of the above information is financial advice, and I'm not a financial advisor. Most of what I have said is just conspiracy theory... but what the hell isn't a conspiracy anymore?
Fuck wall street. Let's drag 'em to hell.
See you at the bell tomorrow
Fuck wall street. Let's drag 'em to hell.
See you at the bell tomorrow
@threadreaderapp unroll
• • •
Missing some Tweet in this thread? You can try to
force a refresh


