
Trend Analysis using moving averages !
A mega thread to understand the Use of 21 , 50 and 200 ema.
4 Effective uses of Exponential Moving Averages !
Which can Help you avoid Big Losses
Retweet and Share :)
#stockmarkets #nifty
A mega thread to understand the Use of 21 , 50 and 200 ema.
4 Effective uses of Exponential Moving Averages !
Which can Help you avoid Big Losses
Retweet and Share :)
#stockmarkets #nifty
Popular uses of moving averages
1. Identifying the direction of trend
2. MA crossover
3. Dynamic Support and Resistance
4. Price Crossing above Key EMAs
Note : In chart 21 ema is red , 50 ema is green and 200 ema is black
2/n
1. Identifying the direction of trend
2. MA crossover
3. Dynamic Support and Resistance
4. Price Crossing above Key EMAs
Note : In chart 21 ema is red , 50 ema is green and 200 ema is black
2/n

Why EMA and not SMA ?
EMA is fast , accurate and prices in recent data !
We are using EMAs on Daily time Frame
Red: 21 , Green : 50 and Black :200
3/n
EMA is fast , accurate and prices in recent data !
We are using EMAs on Daily time Frame
Red: 21 , Green : 50 and Black :200
3/n

Use 1 : Identifying the trend of stock on dtf
The 21 ema will tell us the Short term trend of a stock , while the 200 ema will tell us the long term trend of a stocks
Any EMA that is sloping
:upwards trend is BULLISH
:sideways trend is NEUTRAL
:downwards trend is BEARISH
4/n
The 21 ema will tell us the Short term trend of a stock , while the 200 ema will tell us the long term trend of a stocks
Any EMA that is sloping
:upwards trend is BULLISH
:sideways trend is NEUTRAL
:downwards trend is BEARISH
4/n


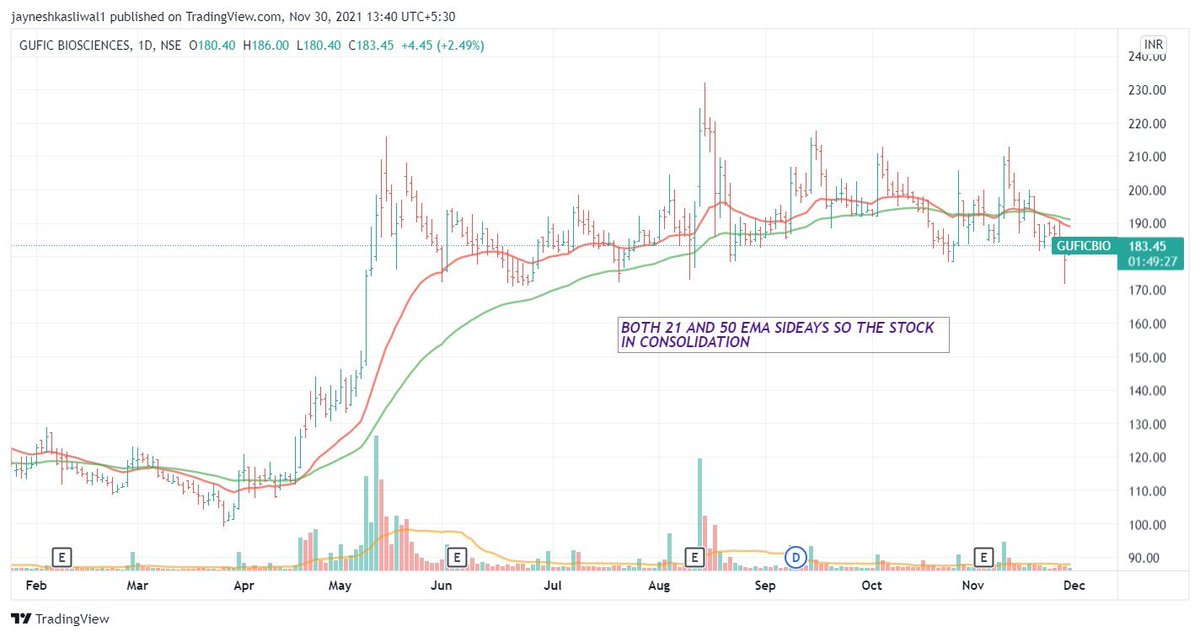
MOVING AVERAGES SIDEWAYS:
When Moving averages turn flat means the stock is in consolidation and is in sideways zone .
Generally this occurs after an uptrend or downtrend and may lead to continuation of previous trend .
This is generally no trading zone for swing traders
5/n
When Moving averages turn flat means the stock is in consolidation and is in sideways zone .
Generally this occurs after an uptrend or downtrend and may lead to continuation of previous trend .
This is generally no trading zone for swing traders
5/n

EMA CROSSOVER
1. Whenever the 21 ema crosses 50 ema from down to up short term trend changes from bearish to bullish and vice versa.
2. The 21 Should be above 50 ema for uptrend and below 50 ema for downtrend
Ex:
7/n
1. Whenever the 21 ema crosses 50 ema from down to up short term trend changes from bearish to bullish and vice versa.
2. The 21 Should be above 50 ema for uptrend and below 50 ema for downtrend
Ex:
7/n


Crossover rules:
Crossover shouldnt be traded solely as it can lead to multiple signals of buy and sell ,always use confirmation of volume , price etc to take trade .
During consolidation you will get many signals and hence its not advised to use during sideways trend
8/n
Crossover shouldnt be traded solely as it can lead to multiple signals of buy and sell ,always use confirmation of volume , price etc to take trade .
During consolidation you will get many signals and hence its not advised to use during sideways trend
8/n
50 and 200 ema crossovers
50 cutting 200 from down : Golden Cross
50 cuttinf 200 from up : Death Cross
The Long term trend changes when DEATH CROSS happens and its one of the most dangerous situations
Price falls raidly after the Death Cross. Example in current market .
9/n
50 cutting 200 from down : Golden Cross
50 cuttinf 200 from up : Death Cross
The Long term trend changes when DEATH CROSS happens and its one of the most dangerous situations
Price falls raidly after the Death Cross. Example in current market .
9/n


DYNAMIC SUPPORT AND RESISTANCE
1. 21 ema Dynamic support for trending stocks in short term
2. 50 ema dynamic support for mid term
3. 200 ema dynamic support for long term
Examples Explained !
10/n
1. 21 ema Dynamic support for trending stocks in short term
2. 50 ema dynamic support for mid term
3. 200 ema dynamic support for long term
Examples Explained !
10/n


PRICE CROSSING AVOVE 200 EMA
200 EMA : THE LONG TERM TREND
1. When a stock price crosses its 200-day moving average, it is a technical signal that a reversal has occurred.
11/n
200 EMA : THE LONG TERM TREND
1. When a stock price crosses its 200-day moving average, it is a technical signal that a reversal has occurred.
11/n


3. A simple rule of not buying stocks below 200 ema for short term trading could save a lot of money
4. One may consider investing in stocks if the stock is below 200 ema only if he is confirmed about the fundamentals of the stock
5. Some may not agree with this and its ok!
12/n
4. One may consider investing in stocks if the stock is below 200 ema only if he is confirmed about the fundamentals of the stock
5. Some may not agree with this and its ok!
12/n


The 200 ema helps to identify where the market breath is
During the corona crash if the simple system was used you would have saved 35% drawdown in your account
Using 200 ema beats the buy and hold strategy which over the years haven been proved in book
200 ema THE SAVIOUR :
13/n
During the corona crash if the simple system was used you would have saved 35% drawdown in your account
Using 200 ema beats the buy and hold strategy which over the years haven been proved in book
200 ema THE SAVIOUR :
13/n


LONG TERM INVESTING WITH 200 EMA
MULTIBAGGER:
#infy #britannia
Most multibagger stocks will stay above weekly 200 ema and take support on that
These are strong fundamental stocks which will outperform the market
Laggards will stay below 200 ema and hence should be avoided
13 END
MULTIBAGGER:
#infy #britannia
Most multibagger stocks will stay above weekly 200 ema and take support on that
These are strong fundamental stocks which will outperform the market
Laggards will stay below 200 ema and hence should be avoided
13 END


Stage Analysis :
14/n
14/n
https://twitter.com/JayneshKasliwal/status/1492721206969061380?s=20&t=9LvyGILpZtd_F987OlAmSg
• • •
Missing some Tweet in this thread? You can try to
force a refresh


