Steve Profile picture
Feb 26, 2022 7 tweets 7 min read Read on X
China equities: A look under the hood (thread)

Monetary easing and rising credit impulse are positive for equities. Valuations are low but technicals
mixed.

Key drags incl Common Prosperity/Internet regulations on $MCHI (not econ) and #Fed hikes.

#China
h/t @jpmorgan
1/ ImageImageImage
Past instances of monetary easing and broad credit growth were positive for equities and economy.

No longer as crystal clear for equities with Common Prosperity "guidance" on index heavy-weight
Internet/tech sector - 32% in just top 10 of $MCHI.

h/t @jpmorgan @iShares
2/ ImageImage
Regulatory tightening on Internet/tech continues, with the eventual scale and timeline is unknown.

Privately-owned enterprises (POE) in social
sectors, which includes Internet/tech, are of highest risk.

wsj.com/articles/meitu…

h/t @GoldmanSachs
3/ ImageImageImage
Tolerance for economic risks has increased to cater policy shifts or cleanups. The scale has surprising for mkts.

Property sector, directly/indirectly ~25% of GDP, is an example of policy surprise. Survival still the key theme there, incl top players.
4/
Internet/tech along with growth stocks have been the key driver #China #equities, both returns and
volatility.

Looking broader to #Fed rate impact, valuations on growth had narrowed vs value. And when this had
happened, it hadn't done well for $MCHI.

h/t @jpmorgan
5/ ImageImageImage
On technicals, #China #equities is oversold on long-term charts.

Short-selling has also reached new
record levels as a reflection of positioning.

However, there has yet been any signs of trend reversal.

h/t @jpmorgan $MCHI
6/ ImageImage
Conclusion: Positives/negatives on balance. Regulatory impact wildcard.

Macro
- #PBOC easing: Positive
- POE regulation: Negative
- #Fed: Negative

Valuations
- Overall: Supportive
- Growth vs Value: Negative

Technicals
- Positioning: Positive
- Trend: Negative but oversold
7/

• • •

Missing some Tweet in this thread? You can try to force a refresh
 

Keep Current with Steve

Steve Profile picture

Stay in touch and get notified when new unrolls are available from this author!

Read all threads

This Thread may be Removed Anytime!

PDF

Twitter may remove this content at anytime! Save it as PDF for later use!

Try unrolling a thread yourself!

how to unroll video
  1. Follow @ThreadReaderApp to mention us!

  2. From a Twitter thread mention us with a keyword "unroll"
@threadreaderapp unroll

Practice here first or read more on our help page!

More from @ssinvestments8

Jan 23, 2023
China Property (thread #5)

Its been exactly a year since the 1st thread on this. Broad-based, coordinated easing eventually came much later than anyone had expected.

JPM has a timeline of easing events over the past year which has yet brought the industry out of the woods.
1/ Image
China Property

First, let's look at the damage. The sector ended up with a 54% default rate or USD 54bn on offshore USD debt in 2022. This was worse than a 31% bear case scenario predicted by GS a year ago.

2/ Image
China Property

The debt defaults were concentrated in private developers. Only ~25% of top 50 POE developers are still considered non-distressed.

Housing is a social sector. This looks like an unwind of the private sector, leaving fundamental demand to be fulfilled by SOEs.
3/ Image
Read 12 tweets
Jan 19, 2023
China in 5 charts (1/5)

What drives overall China equities?

When China Internet $KWEB outperforms MSCI China (grey line), its often positive for China equities $MCHI (orange line).

#China Image
China in 5 charts (2/5)

How does China equities perform when USD weakens?

When USD weakens, China equities strengthens.

Inverted $DXY in grey and $MCHI in orange here.

#China #macro Image
China in 5 charts (3/5)

Is China or US equities better in a weakening USD environment?

When USD is weak, China equities $MCHI tends to outperform US equities.

Inverted $DXY in grey and $MCHI over $SPY in orange here.

#China #macro Image
Read 5 tweets
Dec 17, 2022
China equities - A final top-down look in 2022

MSCI China will be down over -20% for the second year if the year ends today, and the worst yearly decline since 2008. Property crisis, Common Prosperity, US-China tensions and US delisting fears top a full list of risks.
1/
Here is a breakdown of MSCI China by listing locations and sectors (based on $MCHI).

First, on listing location.
1) Delisting risk is almost off the table by now. Only 8% of the index remains listed in the US and half of that are also listed in HK.

and...

2/
Still on listing location...

2) Only 16% of the index is onshore Shanghai or Shenzhen listed, which means only a small portion can directly benefit from onshore liquidity easing while 84% of the market is prone to international flows and sentiment.
3/
scmp.com/economy/china-…
Read 14 tweets
Mar 18, 2022
China Property (thread #3)

Game-changer here?
Liquidity of USD20bn coming vs Mar/Apr maturity wall of USD12bn.

Likely for asset acquisitions, not debt bailout.

Implications for equities/bonds?
1/

#China #property prev threads:


ImageImageImage
China property HY fell -54% and equities -33% since mid-2021.

Bigger dip may not imply bigger rebound.

Equities can be diluted as bonds can be written down. But after that's done, equity returns are symmetric vs asymmetric for bonds, i.e. better risk compensation. $CHIR
2/ ImageImage
China property equities performance out of the trough coincided w sales volume trend.

Sales volume picked up 6 mths after home prices bottomed, which had happened 6 mths after easing.

Past few weeks, easing stance is finally aligned across policymakers.

h/t @jpmorgan $CHIR
3/ ImageImageImageImage
Read 4 tweets
Mar 4, 2022
China Property (thread #2)

Continued stress as developers sales -50% YoY, but home price drop eased.

Property equities $CHIR retreated but +1% YTD.

Bonds -33% YTD with "sell first, think later" mentality. No trust.

More background in prev thread:

1/ ImageImage
Total lack of trust with hidden off-balance sheet debt uncovered bit by bit.

Basically hidden as "minority interest" within balance sheet equity.

With net debt to total equity and to shareholders equity at 68% and 115%, it implies hidden debt at 41% of equity.

h/t @jpmorgan
2/ Image
Land sales is tied to 40%+ of local govt revenue and developers are being forced to deleverage, resulting in lower land acquisitions.

This is a funding problem for social welfare and local govt credit.

When all problems are tied together, a quick solution seems unlikely.

3/ ImageImageImage
Read 4 tweets
Jan 20, 2022
China property market thread #China #RealEstate

1/6 - Base case default rate is 19%. Bull case is 10%...

@GoldmanSachs Image
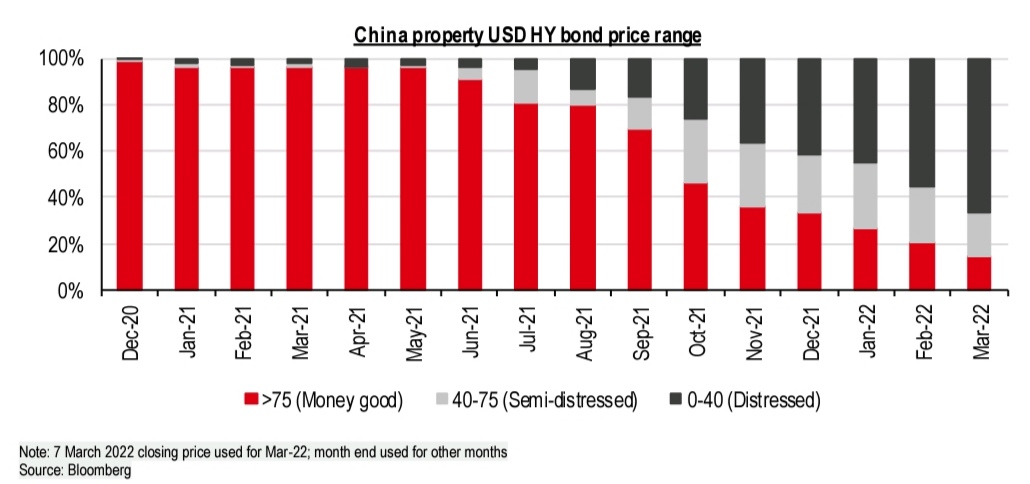
2/6 - 60% of property HY bonds are trading below $40.

@HSBC Image
3/6 - not it's first crisis ever. And was also policy-driven in most cases.

@HSBC Image
Read 8 tweets

Did Thread Reader help you today?

Support us! We are indie developers!


This site is made by just two indie developers on a laptop doing marketing, support and development! Read more about the story.

Become a Premium Member ($3/month or $30/year) and get exclusive features!

Become Premium

Don't want to be a Premium member but still want to support us?

Make a small donation by buying us coffee ($5) or help with server cost ($10)

Donate via Paypal

Or Donate anonymously using crypto!

Ethereum

0xfe58350B80634f60Fa6Dc149a72b4DFbc17D341E copy

Bitcoin

3ATGMxNzCUFzxpMCHL5sWSt4DVtS8UqXpi copy

Thank you for your support!

Follow Us!

:(