0/ This time last week we were finally seeing some upside volatility in crypto and specifically #BTC. Now it seems as if all of that momentum may have switched over to #Gold ?
Let’s take a deeper look under the hood of crypto markets 🧵👇
1/ After touching 45500 resistance again BTC has quickly faded back in line with risk assets that remain heavy as Ukraine conflict intensifies. Key level to hold is now 36500, a break of which open door towards 29k.
2/ Spike in BTC-RUB volumes showed that some citizens are seeing the benefits of digital assets in times of crisis, a more medium bullish dynamic. Ukraine also managed to raise 10s of millions in donations and BTC being used as a medium of exchange on the ground.
3/ My takeaway from @glassnode this week was that there is still more pain to be taken before we can say a major bottom is in. That pain will likely be taken in a re-test of 29/30k should it happen. I'm keeping dry powder.
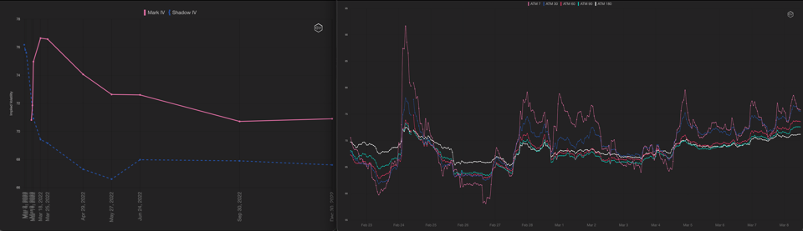
4/ Realised vol drifted back a bit last week to be more in line with implieds as markets sold off in an orderly fashion (more so than stocks). Implied still at a slight discount which is unusual when so much macro risk is out there.
5/ Term structure remained inverted all week as gamma paid and buyers came in for mid/late March expiries to capture FOMC. Weeklies still saw DOV selling flows but less impact than normal as vol is good value here.
6/ Main block flows were 18Mar 34000/42000 strangle buyer, Jun22 45000/60000 call spread buyer and ETH 18Mar 2200 put buyer that helped give ST put skew a bid.
7/ NFT volumes down 72% from peak, explains why no love for ETH and why the ETH/BTC spread is languishing near bottom of range.
8/ As Gold breaks higher, BTC trades heavy. The negative correlation is back last few days, suggests switching happening.
9/ Try out our community by joining our FREE Discord group chat (discord.gg/Dee5gFay) to join the conversation and get info like this & more in real-time.
• • •
Missing some Tweet in this thread? You can try to
force a refresh
For those of you who follow the SPX Vol surface, you will know that SKEW is quite pumped right now. It's still around the 80th percentile after getting hit yesterday.
So does that make it a sell still?
Not necessarily. Because there is a reason why SKEW is expensive. And that reason is that people are willing to pay for VANNA.
So, what the hell is VANNA? Explainer🧵
1/ Vanna is a second-order Greek that represents two things at once. It represents how your VEGA position changes when the underlying spot moves. But it also represents how your DELTA changes when implied volatility moves.
I like to think of it as your realised skew exposure, just like gamma is your realised volatility exposure.
2/ Let's take an example where you have a Vanna position of $100k of Vega per 1% spot change. And you are long downside puts and short upside calls.
You will therefore also have a delta change per implied vol change of $10 million DELTA per 1% vol change.
As the market goes down, you will get longer Vega. If the market goes up, you will get shorter Vega.
And as implied vol goes up, you will get shorter delta. And if implied vol goes down, you will get longer delta.
I saw a reddit post about dispersion today written by a quant. It was pretty good but I feel like the target audience was vol professionals and most people wouldn't have a clue what he was on about.
So here goes....the Options Insight explanation of the famous Dispersion Trade explained in plain English...
Let's imagine the stock market is a choir🧵
1/ The Index (SPX) is the whole choir singing together.
The stocks are the individual singers.
Dispersion trading is about betting on how in-sync the singers are with each other.
2/
If every singer hits the same note perfectly → the choir sounds loud and clear → the SPX moves a lot.
If everyone sings their own tune → the choir sounds softer, even if each singer is loud → SPX goes nowhere.
Perfect sync = high correlation
Everyone doing their own thing = low correlation/high dispersion
Why do YOU need our daily SPX fixed strike vol monitor?
1/ There are so many GEX models out there, saying different things, with different embedded assumptions. For example, @t1alpha suggest that SPX dealers have just flipped short gamma...
2/ But GS see a very different profile, which seems to include a lot of very short dated local gamma supply. This means dealers lose gamma in both directions.
3/ And finally Nomura's well followed @CharlieMcEllig1 and team said recently that the setup is the complete reverse with dealers short upside around the 5000 strike.
Let's dive into last week's options trading insights! Remember, the full details are included in our site weekly blog post (check my profile's linktree).
1/ We saw signs that SPX buying flows might slow down after Friday's OPEX. SPX hasn't dipped, likely buoyed by these Jan OPEX positions, especailly in Mag7 names.
Protecting your US index exposure with Feb24 or Mar24 put spreads makes sense. Post-Jan OPEX, expect less market support due to the fading effect of CHARM and buyback blackouts for earnings.
This creates a chance for tactical shorts in the coming weeks. Our evidence suggests that SPX's end-of-day buying is due to dealers hedging DELTA on Jan24 long GAMMA positions.
According to GS, dealer GAMMA has collapsed, making the markets less stable as we head into mega-cap tech earnings...
2/ We also think it's time to consider VIX call spreads.
Why? The chances of a volatility spike seem higher now. There's been a surge in Feb24 17 calls, pushing VVIX up. This aligns with our observation of increased equity vol. Investors are hedging risks, a sign of market nervousness.
19Jan24 fixed strike vol dropped, but Feb24 and Mar24 firmed up. This indicates dealers covering short-term VEGA from VIX trades.
Even if SPX tests 5000, VIX is unlikely to drop < 12. as VIX beta drops on the way up.
We're buying VIX call spreads to capitalize on the potential vol spike. This approach offers leverage while controlling THETA bleed.
1/ As SPX rips back to its highs, we see breadth deteriorating as the Mag7 are leading the charge once again.
2/ The options flows also back up this move as lots of calls were bought in the Mag7 names, which went deeply in the money and the CHARM effect of these options becoming 100 delta leads to more stock buying. Here is $MSFT 19Jan open interest, but looks the same for $NVDA, $AMZN, etc.
Are options really that risky? Or do you just not know how to size them properly?
This is a common pushback I get from people about options, saying they are way too risky and you can lose all you money trading them.
A thread...
1/ The truth is, yes they can be risky if you don’t know what you’re doing.
If you know how to size them appropriately, then options can seriously enhance you risk-adjusted return profile and allow you to profit from multiple scenarios.
2/ Example 1 - How not to do it - YOLO
You want to speculate on a stock going up because it has a strong trend and the Santa rally is coming. So you buy a 1-week OTM call with 10% of your account capital.