I was toying around on charts and was inquisitive today.
This is NOTHING more than me just having some fun with some charts. That's it. Not a prediction. Just showing time overlaid.
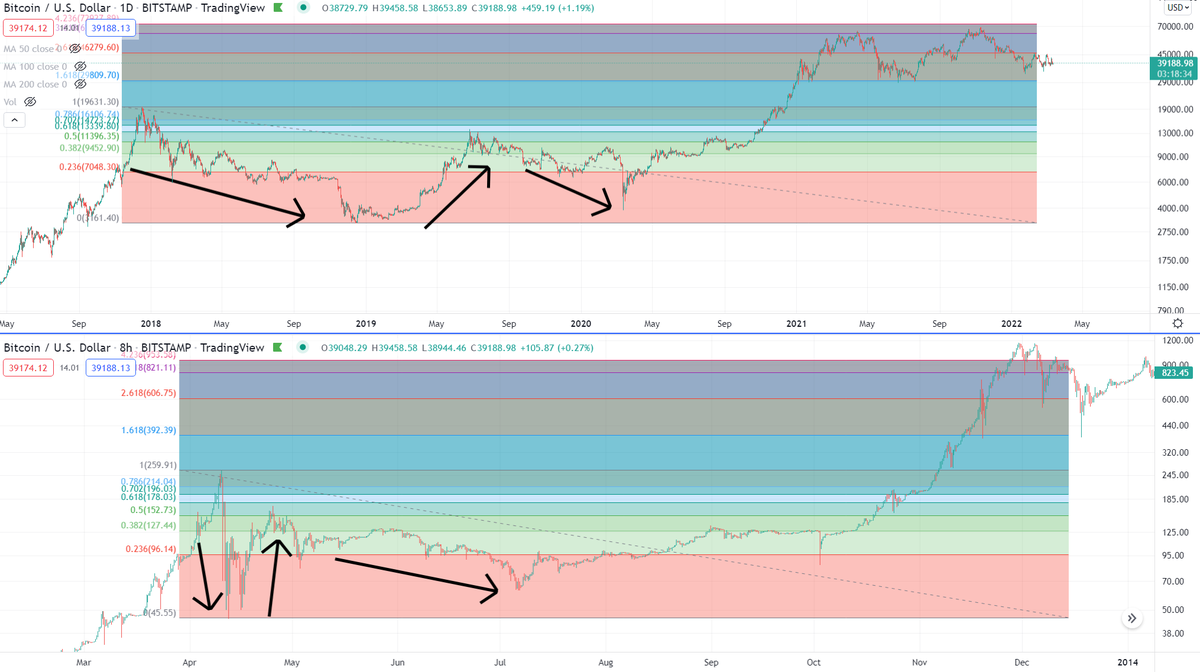
In the 2018 bear market for Bitcoin, it took *332 days* from when the peak hit, until it started to capitulate.
If we drew that from the day Coinbase IPO'd, which was a 6-month top, and the height of On Chain activity and Retail Investor FOMO, we're on *day 331*.
Again, I'm not predicting this. I just wanted to show it.
That was the height of Retail FOMO.
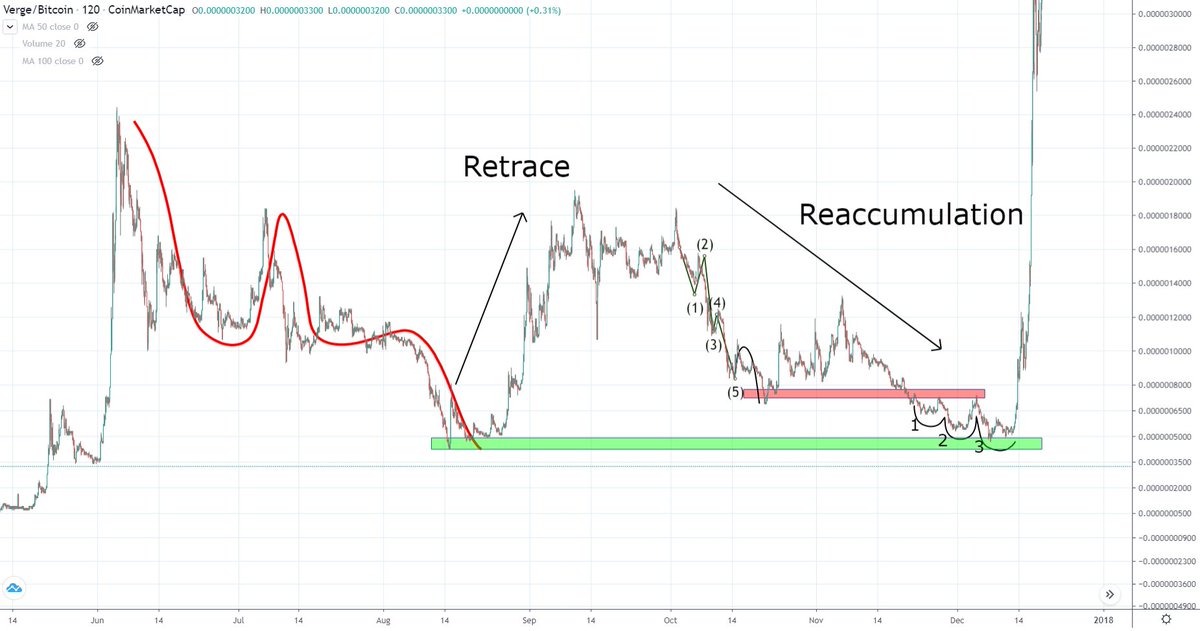
Retraces are the most common thing to occur in Bitcoin and all markets before crashes happen. We have not had a retrace whatsoever.
But it will be nice to celebrate getting past that date.
In addition, Bitcoin and crypto tends to follow the stock market. Like I've shown, the Dow Jones is doing a typical corrective ABC structure with waves of equal length.
But if the Dow started changing or something and the Dow started breaking below 32,000. We'd have something different. And, if that happened, it'd be back to the drawing board.
Otherwise, I thought it'd be celebratory getting beyond that timeframe of 332 days. 🙏🙌
• • •
Missing some Tweet in this thread? You can try to
force a refresh
I've often pointed to the XRP price charts accumulation structure that's been going on since April.
For fun, I've added this chart below. Before you move on in this thread, take a closer look at the chart, and try to guess what asset it is and when it happened?
Did you get it right?
It's Bitcoin from 2013.
An 82% crash in 48-hours. A crash, retrace, re-accumulation structure that went on to reach above a 4.236 extension later in the year.
The structure we had in Bitcoin from 2018-2020 played a large role in why I believed the top was coming in for Bitcoin. I spent years discussing this on YouTube prior to the top happening, so it wasn't a surprise I sounded the alarms there.
This is a pretty climatic moment. I'm not a geopolitical expert or capable of solving 5D chess that gets played during wartime situations. But, we can look at how the charts are reacting to this.
It appears Bitcoin is now deviating from it's 5.5 month structure.
1/12
At the same time that this is all occurring, significant things are happening market wide. For example, in 2014, this was OIL's breakdown level. 5-years of higher lows, then it crashed from here. This moment has caused OIL to break through that resistance.
2/12
At the same time, precious metals are breaking upward, having the biggest days they've seen in years, with Gold, Silver, and Platinum all pushing up.
1/ Tinfoil hat time, because we're about to dive into the Verge chart Vs. Bitcoin in 2017. And... something going on with Litecoin.
This was the setup the XVG/BTC chart had heading into December of 2017. This chart spans a timeframe of about 7-months, before the mega pump.
2/ And, as strange as it seems, on the scale of nearly 8-years, Litecoin has printed a similar structure vs Bitcoin.
3/ If you spend enough time studying every single in and out of what happened between those two fractals on those two timeframes, it shows you the same general thing is going on between the two.
While some extremes are there, the general format is the same.
I believe the top of Bitcoin is the most likely to occur around $72,000-$75,000, leading into a multi-year bear market.
In this thread, I will present my case as to why I believe this.
I want to preface this by saying I've been a bull on Bitcoin for the entirety of my YouTube channel, established in 2019, with 550+ videos published. I was also bullish on Bitcoin during this most recent pullback of Bitcoin in May, June, and July, expecting new All Time Highs.
So, I'm not a mega bear, who is wrong footed in a short position. This is a data driven thread. Take from it what you will. But, it's my best guess and speculation as to where the top of Bitcoin is.
Thanks for coming out to the livestream. With having technical difficulties, I feel I owe a synopsis of what it was about.
Bitcoin is fighting back above the 0.786 heading into the daily close, still looking for a touch above the B-Wave:
1/4
The Total Market Cap of all of crypto has touched above the September 7th top, on "El Salvador" day. Fighting to breakout the cup and handle:
2/4
The Altcoin Market is in the same boat, and it's looking like an impressive move to the upside is the most likely, after taking out the B-Wave, touching above the .786 retrace since September 7th, and consolidating. Upside breakout seems most likely:
The XRP community is pretty excited right now. So, I'm just throwing this out there to show what's been happening.
Remember, we are still in a range.
1/3
And, the price action over the last day has been a 0.702 retrace of the down move from April 6 - April 12.
Ranges can be brutal. And they can take a long time, revisiting the upper and lower boundaries. As for breakouts on the USD chart, we don't have any just yet.
2/3
We just have to be patient, and for me, the real excitement starts once the last fib levels can crack with conviction, which is around $1.75.