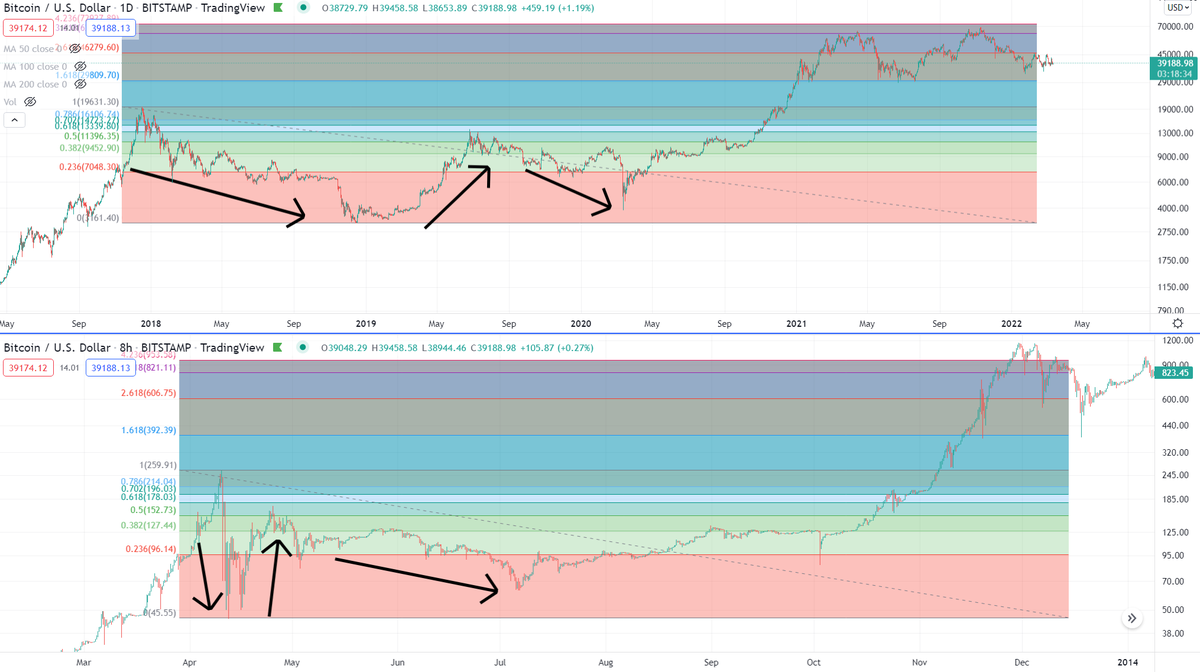
I've often pointed to the XRP price charts accumulation structure that's been going on since April.
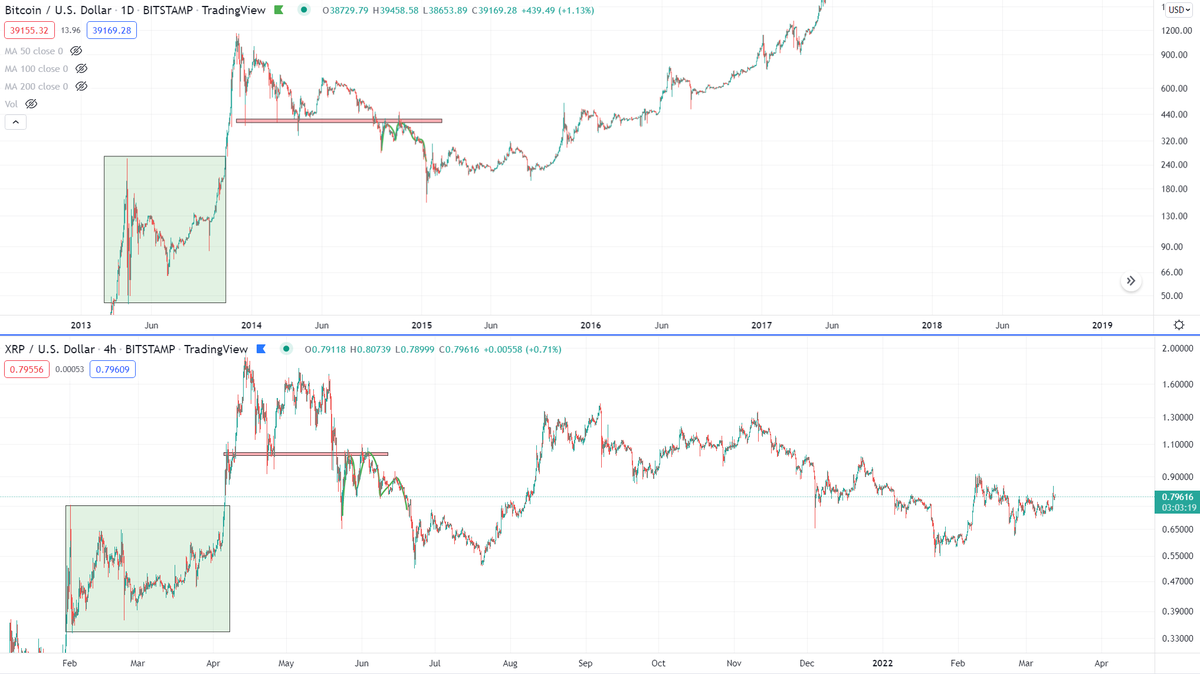
For fun, I've added this chart below. Before you move on in this thread, take a closer look at the chart, and try to guess what asset it is and when it happened?
For fun, I've added this chart below. Before you move on in this thread, take a closer look at the chart, and try to guess what asset it is and when it happened?

Did you get it right?
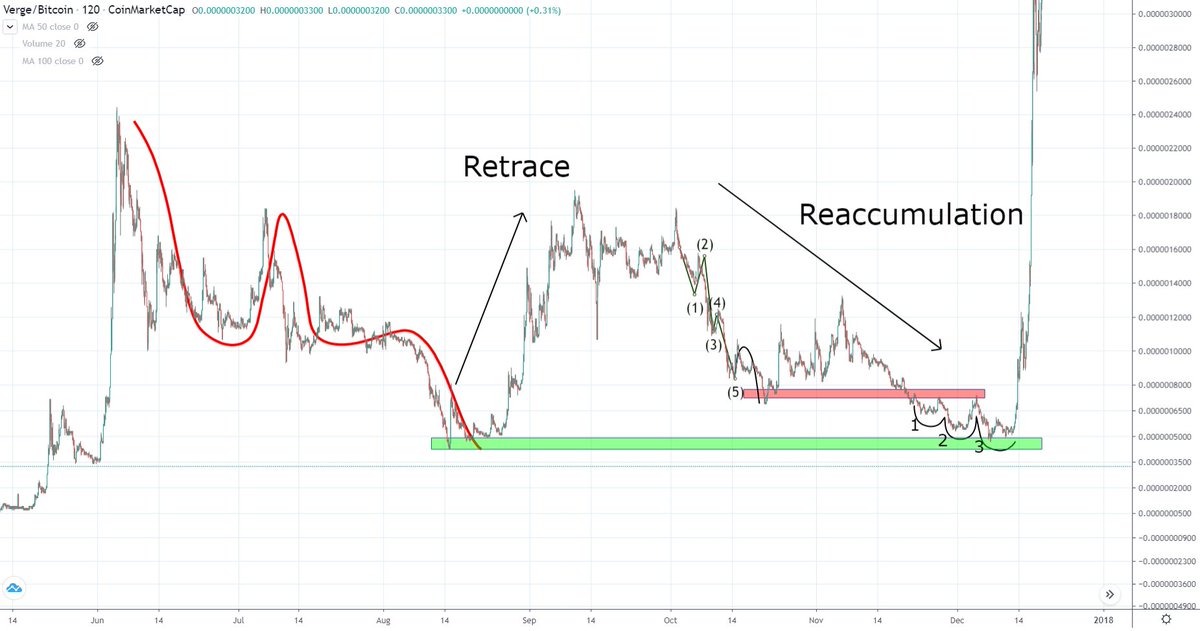
It's Bitcoin from 2013.
An 82% crash in 48-hours. A crash, retrace, re-accumulation structure that went on to reach above a 4.236 extension later in the year.
It's Bitcoin from 2013.
An 82% crash in 48-hours. A crash, retrace, re-accumulation structure that went on to reach above a 4.236 extension later in the year.

The structure we had in Bitcoin from 2018-2020 played a large role in why I believed the top was coming in for Bitcoin. I spent years discussing this on YouTube prior to the top happening, so it wasn't a surprise I sounded the alarms there.
2018-2021 was a repeat of 2013.
2018-2021 was a repeat of 2013.

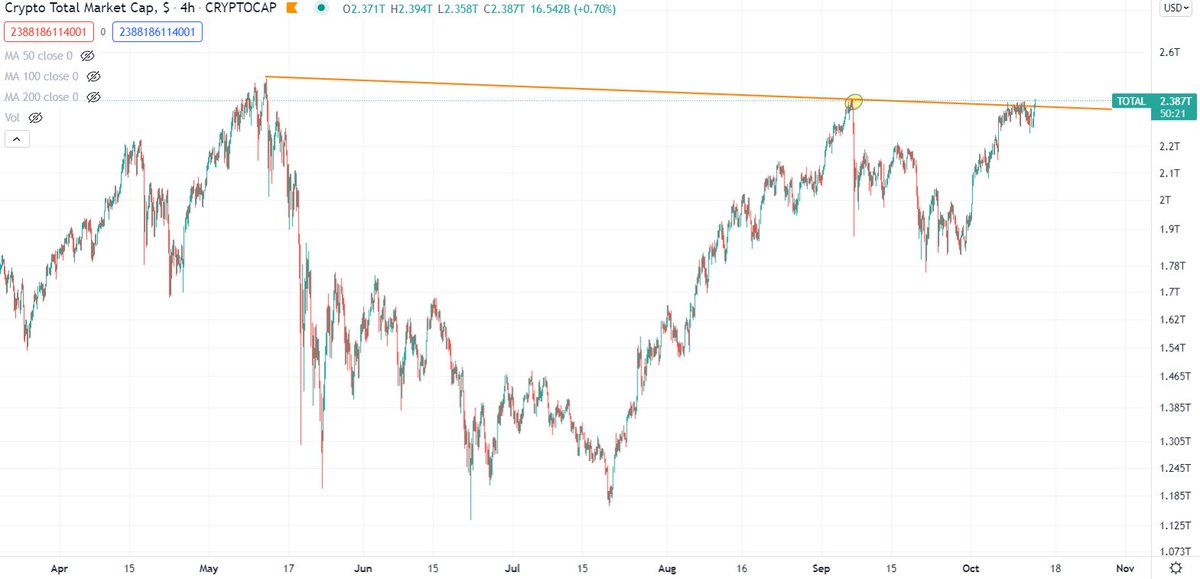
While the USD value came up a tick short of the 4.236 extension, the market cap nailed it.

But the point of this thread is not to talk about Bitcoin. It was just to reference Bitcoin and show accumulation structures. These are common. Crash, Retrace Re-Accumulation.
And like Bitcoin did in 2013, XRP has had the same setup.
And like Bitcoin did in 2013, XRP has had the same setup.

Which of course, lines up with 2018-2020 for Bitcoin as well.

Heck, even the crash and capitulation of XRP's fall since April mirrored that of a full blown completed Bitcoin crash. Falling to similar levels. After the same setups.

And in that circumstance, it of course lead to the 2017 Bitcoin and crypto bull run, where Bitcoin went from $150 to $20,000.
Something like that for XRP would be like $26. But, I'm not here to sell that kind of hopium dream.
My focus is merely on the structure. XRP completed a standard crashing structure in April thru June of 2021, as shown vs Bitcoin.
My focus is merely on the structure. XRP completed a standard crashing structure in April thru June of 2021, as shown vs Bitcoin.
And the accumulation structure here is common.
A crash. Initial retrace back to .618 Fibonacci level. Then a revisit of the lows.
A crash. Initial retrace back to .618 Fibonacci level. Then a revisit of the lows.

Where does that get you? Well, if it followed that, it'd get in you in the $6-7 area.

For me, I focus on the bigger one. The same reach out Ethereum and Bitcoin did, closer to that 3.618 and 4.236 extension, which as you all know is the $10-13 area.

We know Ethereum and Bitcoin both reached the 4.236 extensions on their market cap. What if XRP does that?
Well, that's a 1,500% rise from it's current location on its market cap chart.
Which would be a $12.80 XRP price.
Well, that's a 1,500% rise from it's current location on its market cap chart.
Which would be a $12.80 XRP price.

What if it's just following the market cap fractals from previous run ups?
Even in that circumstance, it exceeds $9.
Even in that circumstance, it exceeds $9.

But, again, circling back to my point. I'm optimistic on XRP because of the charts.
I get asked all the time if developments in the SEC vs Ripple lawsuit will impact price. I have no way to know. I can only speculate on news narratives and psychological reactions. I don't have the answers and any guess I make is not quantitively measurable.
But I can look to these charts. And I can study these structures. And I've seen this time and time again.


And I'm optimistic for Ripple to get a victory vs the SEC yesterday. Not because I'm a Ripple fanboy. I'm happy for the rest of the crypto market to get that Fair Notice victory that they can use. And that it may lead to the relisting of XRP sooner than later. That's my optimism.
But the only control I have is to look at the charts and see if there are any similarities to the past and a reason to be optimistic regarding that.
And for all the things I've shown in this thread on the charts, that's my optimism. That's my hope.
🤞 It plays out that way.
And for all the things I've shown in this thread on the charts, that's my optimism. That's my hope.
🤞 It plays out that way.
• • •
Missing some Tweet in this thread? You can try to
force a refresh