A thread about Network Effects and how to value digital assets:
For Global Macro Investor, my independent research service, @Remi_Tetot and I spent a long time analysing various on chain data sets to see what were the key drivers of network price and network effects ...
For Global Macro Investor, my independent research service, @Remi_Tetot and I spent a long time analysing various on chain data sets to see what were the key drivers of network price and network effects ...
We updated our well known chart of crypto adoption vs the internet (both starting at 5m users). 2021 was an accelerating growth year and the Reed's Law effect of networks built upon networks creating even more exponentiality is clear... 

By yr 6 after the first 5m users, crypto has 295m participants and the internet had 119m. Crypto is growing at 137% a year while the internet grew at 76%. As I always say, this is the fastest adoption of technology the world has ever seen...

If DA's slow their growth to that of the internet's initial growth rate you get to 1.2bn users by Dec 2025 or if we assume the first 6 yrs rate of growth of the internet we get 2.5bn users (shown on linear scale for dramatic effect).

Using the 76% growth rate (suggesting a near halving of network growth as network matures), we now get to 5bn users by 2030. i.e it becomes THE dominant source of owning, transferring and recording value and contactual terms global. Wow!

Ok, but what drives this adoption?
Clearly, everyone owning a part of the network creates alliance of interests which leads to exponential growth...
And, simply put, blockchain is just a better way of doing things in the digital, exponential age.
Clearly, everyone owning a part of the network creates alliance of interests which leads to exponential growth...
And, simply put, blockchain is just a better way of doing things in the digital, exponential age.
In a digital world, everything trends towards zero in cost driven by Moore Law and other phenomena.
But blockchain changed all of that. It created verifiable and immutable digital scarcity allowing an explosion of use cases in the Layer 1, Layer 2 and applications layer
But blockchain changed all of that. It created verifiable and immutable digital scarcity allowing an explosion of use cases in the Layer 1, Layer 2 and applications layer
We now know that Metcalfe's Law is the key valuation model for digital assets but its a hard formula to apply and Im a bit of an idiot so I wanted to find an approximation that helps understand network value.
After a lot of work, trial and error, this is the answer I found:
After a lot of work, trial and error, this is the answer I found:
THE VALUE OF A DIGITAL ASSET NETWORK IS DRIVEN BY
DAILY TRANSACTION VOLUMES (IN DOLLARS OR UNITS OF VALUE)
X
NUMBER OF ACTIVE USERS
DAILY TRANSACTION VOLUMES (IN DOLLARS OR UNITS OF VALUE)
X
NUMBER OF ACTIVE USERS
When you apply this formula to digital asset networks, you get a really good fit.
Here is Bitcoin #Bitcoin
Here is Bitcoin #Bitcoin

Here is #Ethereum

It even works for XRP..

Or Polkadot...

As we get more data we will keep building more of these to test our hypothesis but I think it will apply to all networks, even to NFT communities (most likely pfp's and not art).
This allows us to know if a network is getting true adoption and how it will effect price or market cap.
Im guessing that we can then build models around rates of change in the network to give signals.
Im guessing that we can then build models around rates of change in the network to give signals.
We've recently been tinkering with 3m on 3m ROC. Bitcoins recent slight outperformance can be explained by increased network activity vs others. Interesting to see the ROC change from all picking up but too early to say that is going to be the start of a positive trend.

It also explains why ETH outperformed BTC. The network was growing faster...(but less so this year, hence why ETH has underperformed a bit).

I think that networks that burn token supply will likely outperform over time and that needs to be taken account into the model at some point. In ETH, its the transactions volume that drives that (EIP-1559 and the upcoming merge).

That same metric doesn't apply to chains that have high transaction volume but don't burn tokens. For those chains, it's the daily volume in dollars (or units of value) that matters NOT the number of transactions.
What is interesting is that price is not an input into the model.
What it says is that the value of a network is how much value gets transferred and how many people are active participants transferring that value.
What it says is that the value of a network is how much value gets transferred and how many people are active participants transferring that value.
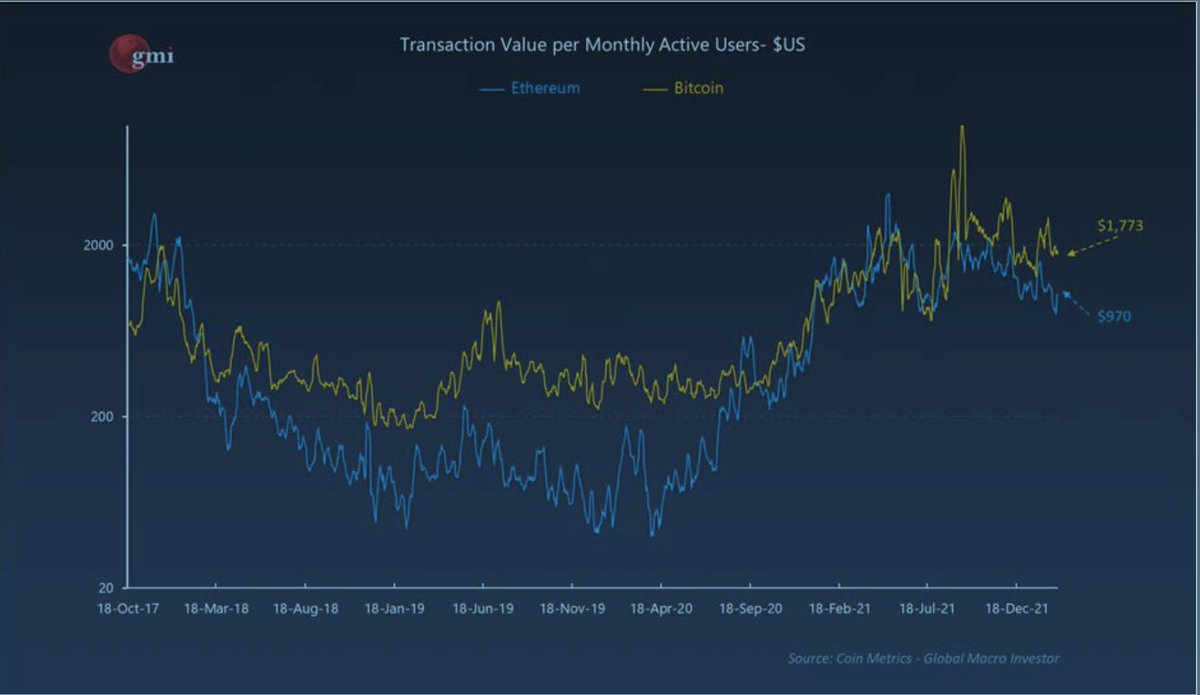
Each chain creates value for different reasons - BTC for pristine collateral, security and SOV brings large numbers of users transferring large sums of value. Hence why it is the most valuable network,
But ETH has more applications and the transaction value per monthly user is broadly in line with BTC. Thus, if ETH attracts more users over time, it will flippen BTC in market cap (not that it matters as we are comparing apples with oranges! Both have different value/uses).
Before the pedants talk about dual axis etc. I am just trying to find a best approximation, not a mathematically elegant and perfect formula contextualisation and understanding beats perfection.
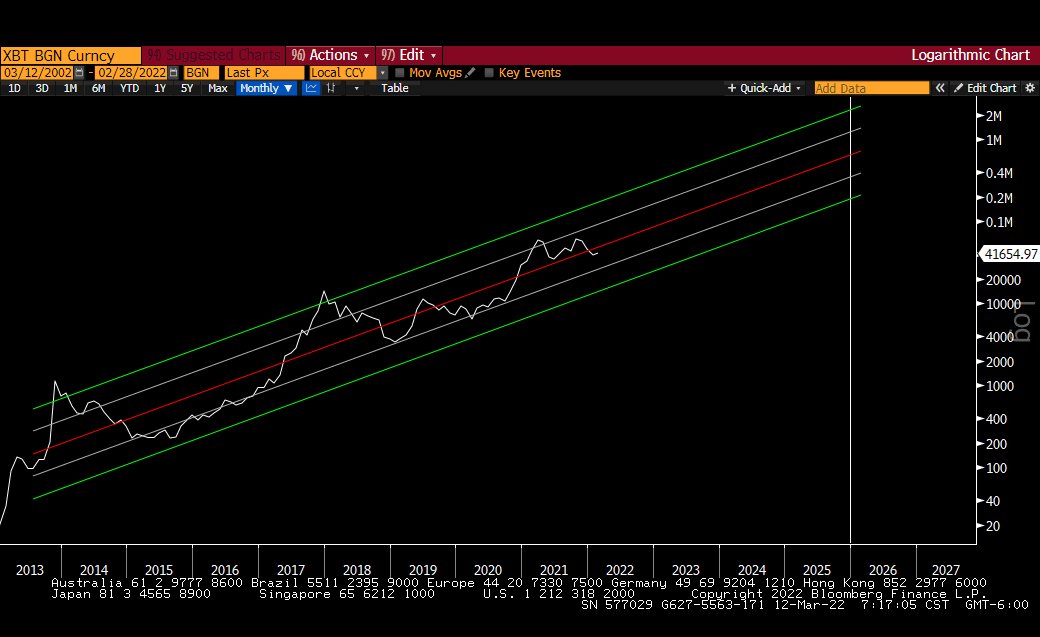
But, if a network continues to create network effects then the log regression channel is still an excellent way of forecasting the future...
Assuming BTC remains 1 standard deviation below trend it gives a price target of $600,000
Assuming BTC remains 1 standard deviation below trend it gives a price target of $600,000

If it slows to 2 SD below trend then you get a number of around $300,000.
Maybe the regression trend should be taken from 2013 to avoid the very early spike. That gives slower growth and lower targets..that give trend at $700k, 1 sd below at $350k and 2 sd at $200k.
Maybe the regression trend should be taken from 2013 to avoid the very early spike. That gives slower growth and lower targets..that give trend at $700k, 1 sd below at $350k and 2 sd at $200k.
I hope you find this work useful in gaining understanding how these digital asset networks accrue value. To truly build value, they need use cases that transfer large ongoing volumes between lots of users.
End.
End.
@threadreaderapp unroll
• • •
Missing some Tweet in this thread? You can try to
force a refresh