
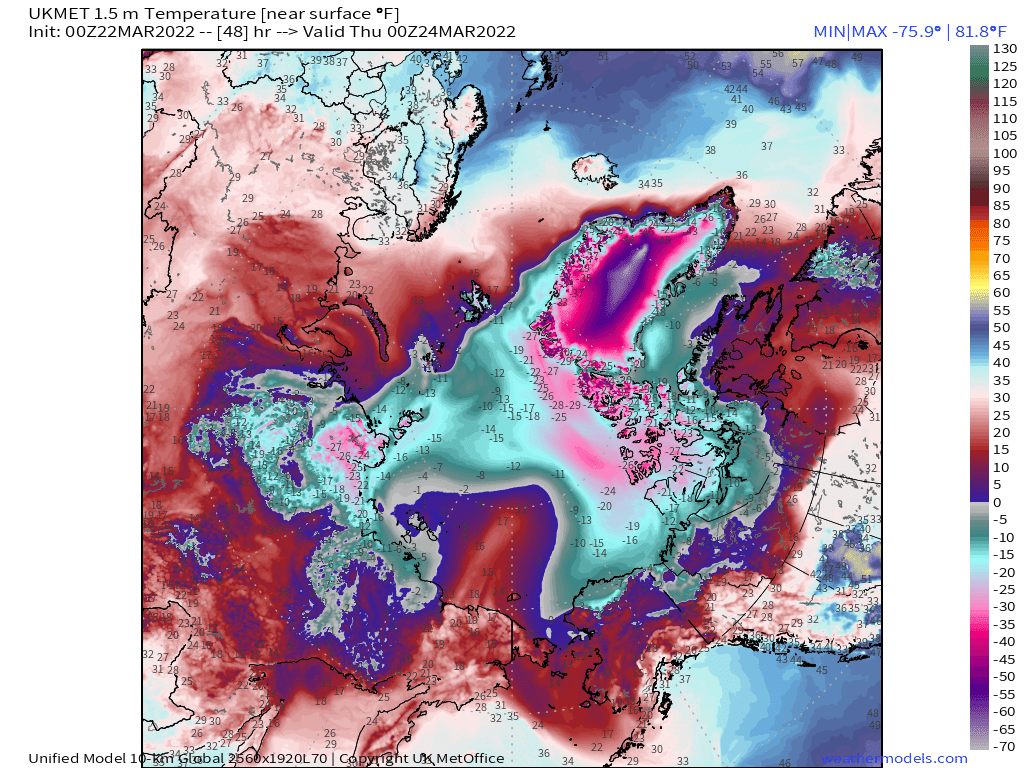
#Equinox is also the moment when the incoming energy balance shifts from the Southern to the Northern Hemisphere, and it was marked this year with some extraordinary temperature anomalies in the Arctic and Antarctic. Both caused by atmospheric rivers.
#ClimateChangeNow thread...
#ClimateChangeNow thread...
https://twitter.com/althecat/status/1506278272451158023

And this year the northern hemisphere #extremeweather season has a Herald, a designated tropical disturbance which the JTWC had thought might become a cyclone. Whilst early this morning a cyclone formation warning was cancelled, the storm appears to not be giving up so easily.
This @zoom_earth animation shows the last six hours of explosive convection which picked up quickly after the storm moved back over the sea in the Bay of Bengal.
If it what Wikipedia is currently calling Deep Depression Bob 2, may yet still become Cyclone Asani, which means "rebellion" in Swahili. [ref. en.wikipedia.org/wiki/2022_Nort…]

Here are some additional pictures from today of Bob/91b. In the final one you can also see Tropical Cyclone Charlotte which is heading south towards Western Australia.


Here you can see the impact that Charlotte is set to have on Australia and NZ, contributing to significant possibly #extremeweather flooding events in both New South Wales and NZ. This is a PWAT anomaly plot showing a forecast of usually wet pars of the atmosphere.
These 16 day long range model forecasts of PWAT anomaly provide an easy way to identify possible #ExtremeRainfall events at a glance. And at very large scale the physics of atmospheric water appears to be highly predictable (with the exception of cyclones).
Weather like history seems to rhyme at times, and whilst also different, this rain event has some similarities (in terms of causation and timing) to last years devastating NSW floods (see attached thread).
https://twitter.com/althecat/status/1373223741380046851?s=20&t=4MIYhdoyvfpGWSGZxHTV2g

The Australians did some post flood analysis on this event and came to some interesting conclusions.
article >> theconversation.com/the-east-coast…
scientific paper >> agupubs.onlinelibrary.wiley.com/doi/abs/10.102…
article >> theconversation.com/the-east-coast…
scientific paper >> agupubs.onlinelibrary.wiley.com/doi/abs/10.102…
Namely, this finding in November 2021. "We found that the probability of long duration high water vapor transport over Sydney, as in March 2021, may increase by 80%."
One which has proven to be true in February and March 2022.
One which has proven to be true in February and March 2022.

Now this is an usually clear example we see hear in NSW of Climate Change Now. But it is far from the only one. Increasing cyclone seasons - duration, number of storms and intensity - is obvious now in the Atlantic, West Pacific and South Indian Ocean.
Here we have a16-day PWAT forecast for the North Indian Ocean - which had a dangerous 2021 cyclone season.
We can see what may become Cyclone Asani at the start, followed by intensification of the SEA monsoon, creating conditions which may soon bring rain to India's East Coast.
We can see what may become Cyclone Asani at the start, followed by intensification of the SEA monsoon, creating conditions which may soon bring rain to India's East Coast.
Water in the atmosphere is a correlate of energy/heat, which is why flooding events were so prolific in the Northern Hemisphere summer - catastrophically so in China and Western Europe in July.
And the Equinox signals the beginning of a sharp rise in Nth Hemisphere energy.
And the Equinox signals the beginning of a sharp rise in Nth Hemisphere energy.
As mentioned earlier, PWAT anomaly model forecast data is a useful way to quickly identify upcoming #extremeweather precipitation events, resulting from unusual concentrations of atmospheric water.
This animation shows a 16 day model forecast for Africa.
This animation shows a 16 day model forecast for Africa.
There are two interesting concentrations in this forecast, albeit not harmful. The first one shows an monsoon burst to the north over the Western Sahel, and the 2nd at the end shows a lot of moisture over the Eastern Sahel.
This satellite animation shows the Western Sahel today.
This satellite animation shows the Western Sahel today.
In the animation you can also see a lesser anomaly over the Horn of Africa where rains are beginning to build slightly earlier than they did last year. (See also attached thread on this.
https://twitter.com/althecat/status/1506253846942781449?s=20&t=WcvdId5T7HVfjj0dpPHYFg)
Here we see the North Amazon today, a major source of atmospheric water, one of the largest.
The 16 day forecast for South America shows the monsoon strengthening but not significantly yet.
This animation shows the impact of Tropical Depression 91b BoB (Bay of Bengal) 2. on China. The take out for me from this is that a tropical storm need not become a cyclone for it to have a significant impact on weather - in this case in Southern China.
This animation shows the West Pacific tropical belt, which produced several dangerous typhoons last year, most notably Super Typhoon Rai in the Phillipines and Super Typhoon Infa in China.
Here is the West Pacific 16-day PWAT anomaly forecast, which is fairly spectacular and contains significant extreme rain events for Beijing, Korea and Japan.
The wider angle Eurasia plot of this data shows this event along with some downstream consequences of the Saharan water transport event noted earlier.
Moving further east the stormy weather being experienced in the United States looks set to continue unabated.
Atmospheric water traffic jams and rivers in the North Atlantic have been a feature of the winder and they continue to be. The fairly stationary blocking low seen here over New Foundland is not particularly typical though.
The immediate cause of this is two high pressure systems centered over Scandinavia and Poland - which can also be seen a significant atmospheric height anomaly.


Albeit one that is not likely to withstand the impact of the torrent of atmospheric water coming across the Atlantic for long.
As we can see here in the 16 day PWAT anomaly animation for Europe, the calm will not last long. Italy Greece and the Balkans look set to potentially have significant rainfall when an atmospheric river from the Nth Atl. collides with one coming in over the Sahara.
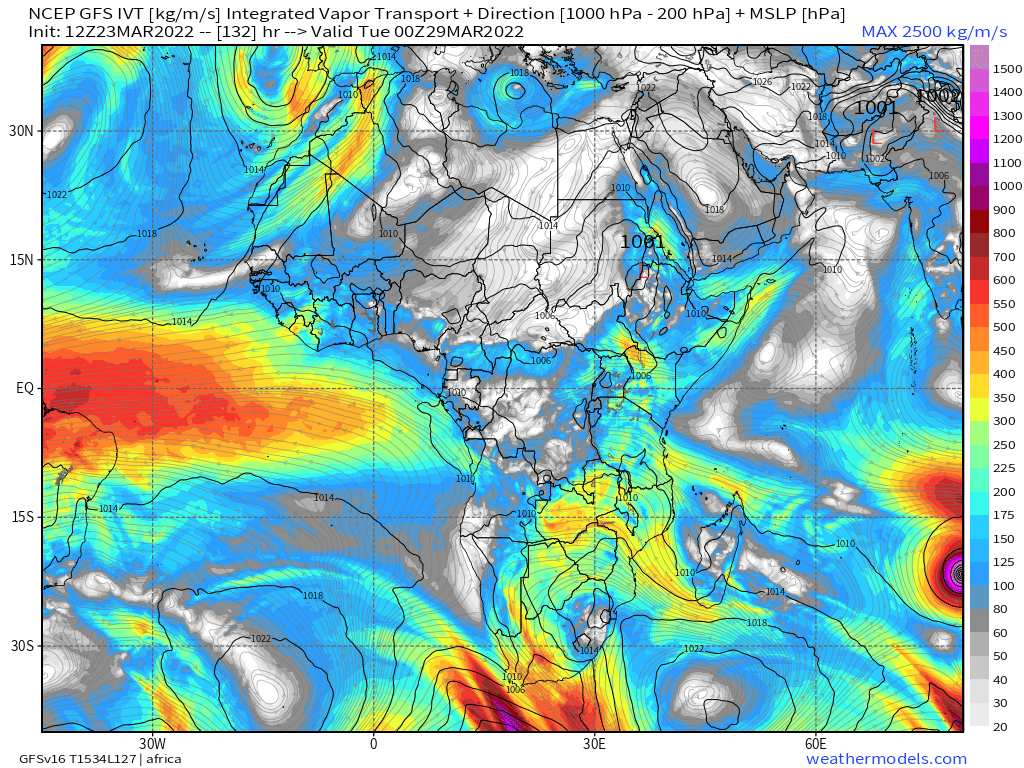
Whilst there is nothing in the model of note here water wise over the Middle East. The PWAT anomaly over Sudan is interesting and unusual, particularly its direction of travel.
This section of the IWVT model data allows us to identify the source of this water - a flow of moisture up the Red Sea which turns west over Sudan and contributes to the build up in atmospheric water seen earlier over the Eastern Sahel.
The North Indian Ocean presumably also has something to do with this. Unfortunately these two dimensional plots do not do a particularly good job of illustrating the complexity of these water flows - which are often simultaneously in multiple directions at different altitudes.
Again the IWVT (integrated water vapour transport) plot resolves the mystery. And the explanation is complex. It will be interesting to see this play out.

Full relevant plot image here....
Finally we return to the West Pacific/SEA/China area which is where we the most significant convective atmospheric water transport activity originates.
But as we can see here, water coming in from the North Indian Ocean and the Atlantic/Amazon via the Sahara is also significant.
But as we can see here, water coming in from the North Indian Ocean and the Atlantic/Amazon via the Sahara is also significant.
Here we see the raw PWAT data and the source of so much of this water, convection over the Pacific Ocean tropical corridor which has moved north and is now moving water westward just north of the Equator.
The return leg of this water in an arc over the Philippines and then north east past China and Japan is (I think) a significant contributor to the stormy weather conditions in North America - these water flows can be seen here in a PWAT anomaly plot of the massive North Pacific.
To end this special northern Hemisphere #Equinox special #ClimateChangeNow thread here are a series of corresponding 16-day accumulated rainfall plots for land masses in the Northern Hemisphere.
1/ #eurasia
2/ #China
3/ #India
1/ #eurasia
2/ #China
3/ #India


• • •
Missing some Tweet in this thread? You can try to
force a refresh


