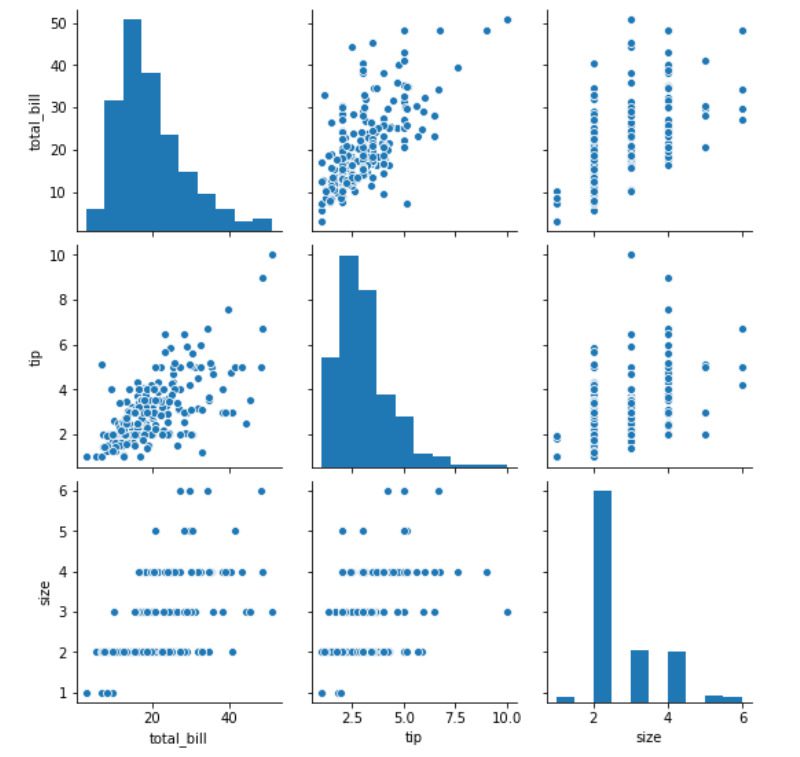
🔎 Learn to create beautiful charts in Python using the Seaborn library: kdnuggets.com/2022/04/data-v…

#Python #DataVisualization #Seaborn
Histogram: The chart above is a simple histogram of the “total_bill” variable. At a glance, we can see that a single meal at this restaurant generally costs around $10 to $25, and there is a positive skew due to some diners ordering more expensive food with prices above $50.
Count Plot: Now, let’s look at the number of male and female diners at the restaurant, to determine the gender that visits the eatery more often.
Bar Chart: Now, let’s try visualizing the relationship between two variables — “sex” and “total_bill” to see if there is a difference in the amount spent by men and women when dining out.
Box plots are a useful way to understand the spread of a variable, and provides us with a five number summary of the data point — minimum, first quartile, median, third quartile, maximum.
A regression plot is the best way to visualize the relationship between two numeric variables. Using Seaborn’s lmplot() function, a regression line is created to demonstrate the correlation between X and Y.

• • •

Missing some Tweet in this thread? You can try to force a refresh
 

Keep Current with Data Science Dojo

Data Science Dojo Profile picture

Stay in touch and get notified when new unrolls are available from this author!

Read all threads

This Thread may be Removed Anytime!

PDF

Twitter may remove this content at anytime! Save it as PDF for later use!

Try unrolling a thread yourself!

how to unroll video
  1. Follow @ThreadReaderApp to mention us!

  2. From a Twitter thread mention us with a keyword "unroll"
@threadreaderapp unroll

Practice here first or read more on our help page!

More from @DataScienceDojo

Apr 13
Job Hunting for Data Analysts twitter.com/i/broadcasts/1…
If you would like to join us on Zoom please follow the link: us02web.zoom.us/j/84735143519
Thank you everyone for joining our webinar today. If you're enjoying the session today make sure to stay tuned with our future webinars, blogs, infographics, and trending data science topics by subscribing to our weekly newsletter: datasciencedojo.com/newsletter/
Read 12 tweets
Apr 12
Getting Started with Modern Data-Warehousing using Snowflake Platform twitter.com/i/broadcasts/1…
You can Join us on zoom here: us02web.zoom.us/j/82874250502
Thank you everyone for joining our webinar today. If you're enjoying the session today make sure to stay tuned with our future webinars, blogs, infographics, and trending data science topics by subscribing to our weekly newsletter: datasciencedojo.com/newsletter/
Read 19 tweets
Apr 12
🤔 Every email marketing campaign will succeed or fail, but how do you categorize something as a success or a failure? That's where metrics come in: online.datasciencedojo.com/blogs/measure-…

#MarketingAnalytics #EmailMarketing #DSDojo
1. A conversion is characterized as a completed action towards a goal. Whether it's signing up for a newsletter or buying a pair of sunglasses, someone performed an action that brought you closer to completing your goal.
2. CTR is the number of clicks on links within your email that take potential customers to a landing page. It could be a button, picture, or text,but the important thing is someone clicked-on something that was meant to be clicked on.
Read 7 tweets
Mar 1
💡 Top 6 Python Libraries for Machine Learning: arpatech.com/blog/top-6-pyt…

#MachineLearning #Python #Libraries Image
1. Numpy is a library that handles data, particularly one that helps us to manage large multidimensional arrays along with a huge collection of mathematical operations.
2. TensorFlow is an end-to-end python machine learning library to run numerical high-end computations.
Read 7 tweets
Jan 4
👉 3 Tools to Track and Visualize the Execution of Your Python Code: kdnuggets.com/2021/12/3-tool…

#Python #VisualizationTools #DataScience
1.Loguru:Loguru is a library that aims to make logging in Python enjoyable. Loguru provides many interesting functionalities, but one functionality that is the most helpful is the ability to catch unexpected errors and display which value of a variable causes your code to fail.
2. snoop: snoop is a Python package that prints the lines of code being executed along with the values of each variable by adding only one decorator.
Read 4 tweets
Sep 7, 2021
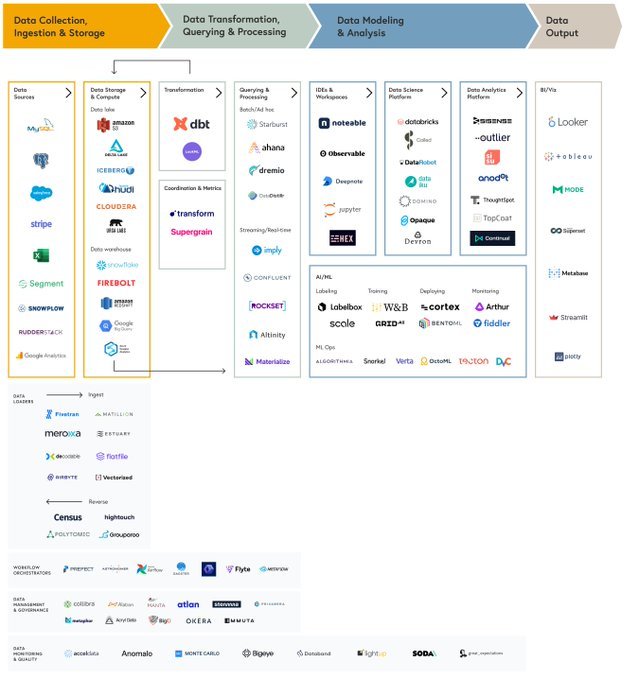
💡 A comprehensive roadmap to data infrastructure: bvp.com/atlas/roadmap-…

#DataInfrastructure #Roadmap #DataScience
1. Growth in adoption of cloud software: As companies in all industries and sizes adopt various cloud-based software to run their businesses, they have had to deal with data sprawl across a number of different sources and systems.
2. Increase in the volume of accessible data: Movement to the cloud and the growth of software users around the world has also generated more data at an exponential rate.
Read 7 tweets

Did Thread Reader help you today?

Support us! We are indie developers!


This site is made by just two indie developers on a laptop doing marketing, support and development! Read more about the story.

Become a Premium Member ($3/month or $30/year) and get exclusive features!

Become Premium

Don't want to be a Premium member but still want to support us?

Make a small donation by buying us coffee ($5) or help with server cost ($10)

Donate via Paypal

Or Donate anonymously using crypto!

Ethereum

0xfe58350B80634f60Fa6Dc149a72b4DFbc17D341E copy

Bitcoin

3ATGMxNzCUFzxpMCHL5sWSt4DVtS8UqXpi copy

Thank you for your support!

Follow Us on Twitter!

:(