#Nifty
Started last fall fm "17664" on 13th with 1 & 2
Would complete 3rd @ open @ 17220-263, then 4th & 5th.
Last fall #retracement from "17512 - 172xx"
MEma-17175
WLEma-17155
50DSma-17165
Pivot's S3-17195
VF's T6: 17197
IF correction, it must limit to 17220 @ open & then 17165
Based on significant gap down, the "revised trade levels" for the "day" & "Week".
#Nifty @ 17108-137 of VF's trade table's key level with a low of "17130"
#Nifty 3rd done @ 17130 or 1 more low till below 17170
Above 17170 to test day's high+
• • •
Missing some Tweet in this thread? You can try to
force a refresh
#Nifty
Index & most stocks done 3rd & 4th wave yesterday.
Holding approx. yesterday's low, "5th" wave to unfold today in opening session towards "16796-816".
Alt: Consolidation in most part of the day in yesterday's range.
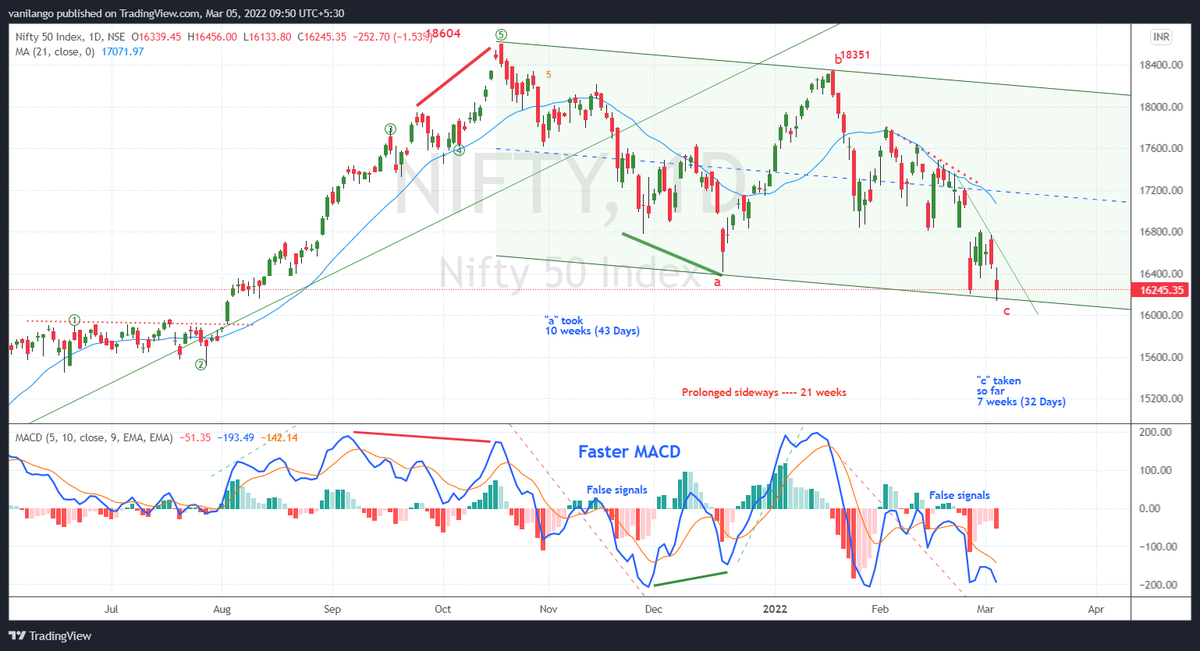
Macd is the simplest & most reliable indicators available. Macd uses Moving Averages & turn them into momentum indicator by subtracting longer MA from shorter MA. The subtracted value when plotted forms a line that oscillates above & below zero, without any upper/ lower limits.
Using shorter Moving Average (5 & 10) will produce a quicker, more responsive indicator (fast macd), while using longer MA (12 & 26) will produce a slower indicator (Slow macd), less prone to whipsaws.
Macd measures the difference between two Exponential Moving Averages (EMAs).
A +ve Macd indicates that 5 or 12-day Ema is trading above 10 or 26-day Ema. A -ve Macd indicates that 5 or 12-day Ema is trading below 10 or 26-day Ema. If Macd is -ve & declining, then -ve gap between faster MA & slower MA is expanding & Downward momentum is accelerating..
#Nifty
There are 2 Key retraces to follow for the Day.
1st is fm 17281 - 17420 @ 17330-350 (Aggressive)
2nd is fm 17064 - 17420 @ 17240-285(Conservative)
Based on Pivot tables,
17310-335 is a key support zone,
17470-500 is a key resistance zone.
#Nifty
There are 2 Key retraces to follow for the Day.
1st is fm 17281 - 17420 @ 17330-350 (Aggressive)
2nd is fm 17064 - 17420 @ 17240-285(Conservative)
Based on Pivot tables,
17310-335 is a key support zone,
17470-500 is a key resistance zone.
#Nifty
Based on Pivot tables,
17310-335 is a key support zone,
17470-500 is a key resistance zone.
Didn't get the "BUY" trade
BUT, a "Sell" trade emerged @ "17470-500" with a high of 17490 with OB readings and generated
100+ points with a low of "17362"
#Nifty
Aggressively holding "17140" approx. at open
OR
Conservatively holding "17080" approx. at open
for the 1st 1-2 hours trade
2 Retraces shown in "1 Minute chart"
#Nifty held "17140" with a low of "17149"
High presently "17241" so far
Ensure to book part profits and trail with the retrace of current rise from 17149 to 17xxx
#Nifty
Be Flexible in labeling.
Holding now 17180-195