
First up let me just say, I cannot predict the future...
I can offer 12+ years of market experience & nothing more
The $Dxy has positioned itself for a humongous Bullish move...
Major multi year & even multi decade #Dxy breakouts are happening *Right Now*
Charts Below 📈🧵👇
I can offer 12+ years of market experience & nothing more
The $Dxy has positioned itself for a humongous Bullish move...
Major multi year & even multi decade #Dxy breakouts are happening *Right Now*
Charts Below 📈🧵👇
Lets start by looking at the $Dxy itself (Monthly Chart)
On this time frame we are close to breaking out of a 7 year consolidation (when the 2015 rally stalled out)
This failure to make a low, followed by a break higher, tends to create a large amount of short covering...
On this time frame we are close to breaking out of a 7 year consolidation (when the 2015 rally stalled out)
This failure to make a low, followed by a break higher, tends to create a large amount of short covering...
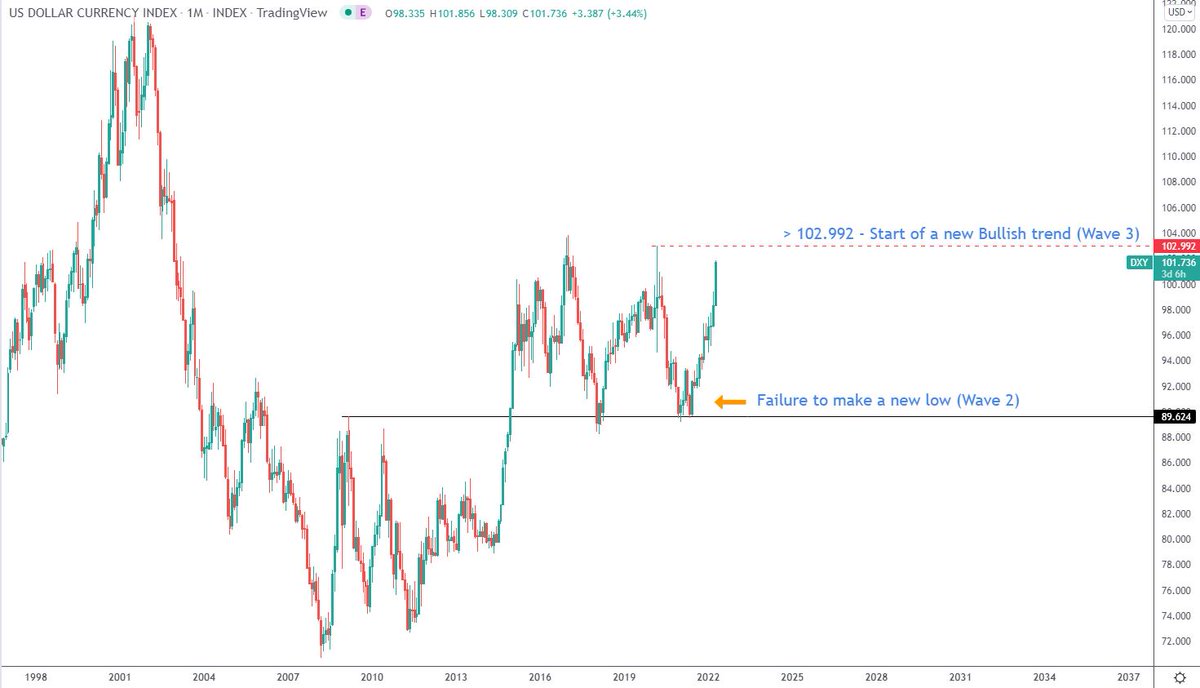
As shorts close out positions on the breakout & new traders add long positions, explosive moves tend to follow
These are the mechanics behind what some traders refer to as a "Wave 3"
To me it's just mechanics of a successful breakout, but "Wave 3" if it helps understanding...
These are the mechanics behind what some traders refer to as a "Wave 3"
To me it's just mechanics of a successful breakout, but "Wave 3" if it helps understanding...
The bare minimum you'd expect a successful breakout here to go to is 1 x the 1st leg before the failed low
That would put $Dxy at almost 118. The *technical extension of this move would actually be 2.618 which would be 141.5!
I've seen TONNES of these go to 2,3,4 X & more...
That would put $Dxy at almost 118. The *technical extension of this move would actually be 2.618 which would be 141.5!
I've seen TONNES of these go to 2,3,4 X & more...

So ok, let's not get carried away. Lets take 118 conservatively & look for context on even higher time frames
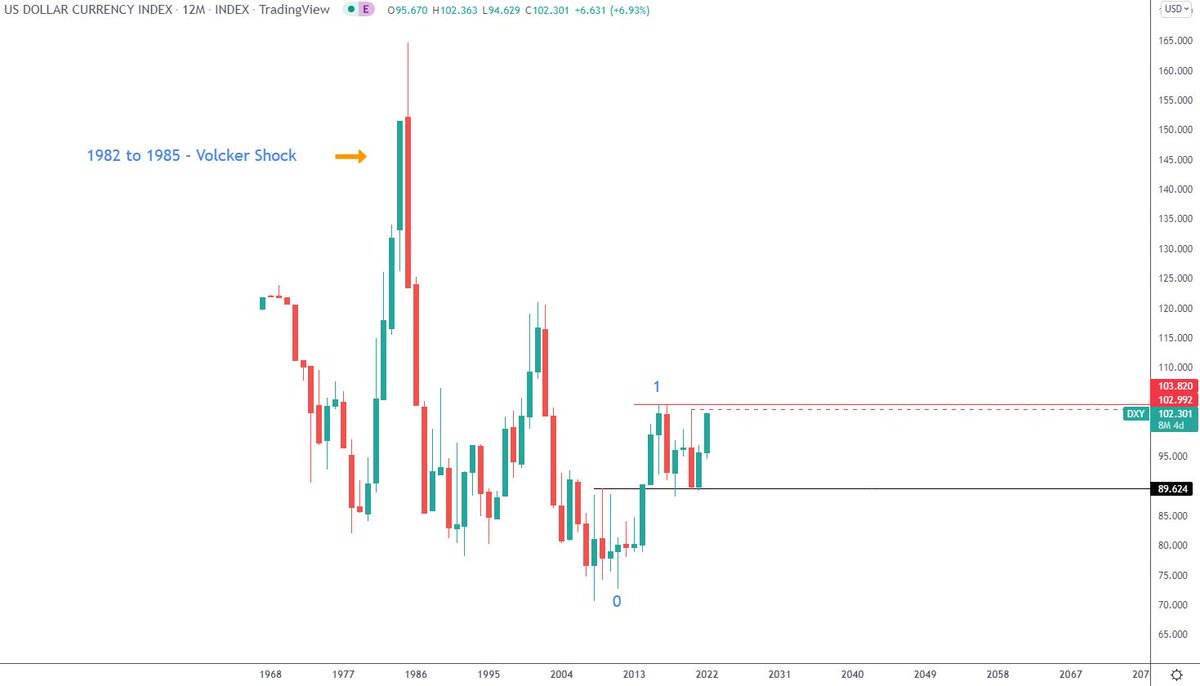
Wow - On a yearly chart the 7 year consolidation we're about to try & break out of was a RE-TEST of a prior 7 year breakout
1x prior move (Conservative Target) = 135!
Wow - On a yearly chart the 7 year consolidation we're about to try & break out of was a RE-TEST of a prior 7 year breakout
1x prior move (Conservative Target) = 135!

Were I trading this on lower timeframes, as I have done many many times, I'd at least be looking at that previous high at 121.02, not much more than the Monthly 1x target from earlier (118)
That previous high is... 2001. The Dot Com crash 😮
That previous high is... 2001. The Dot Com crash 😮

So if the #US falls into recession, as seems likely, it looks very feasible we could see 118-121 again on a flight to safety
Surely it couldn't get higher than that? FED wouldn't allow it
Only time it rallied higher before was 1982/85...
The Volcker Shock to crush inflation😅
Surely it couldn't get higher than that? FED wouldn't allow it
Only time it rallied higher before was 1982/85...
The Volcker Shock to crush inflation😅
Ok, so the Volcker era isn't exactly the same as now.
US Interest Rates at 20% are Good Night Vienna with current US Debt levels.
Fact is #FED now has to crush inflation & the last time it did that the $DXY went to a high of 164.72
$Dxy at 118 to 121 sounds less & less crazy..
US Interest Rates at 20% are Good Night Vienna with current US Debt levels.
Fact is #FED now has to crush inflation & the last time it did that the $DXY went to a high of 164.72
$Dxy at 118 to 121 sounds less & less crazy..
The next thing to look at then is $Dxy vs other currencies. If a big rally is coming in the $Dxy, it is going to show up across multiple pairs & charts
Lets start with the obvious $EurUsd
Same Monthly set up but reversed
Conservative Target 0.8716
Technical Target 0.5610...
Lets start with the obvious $EurUsd
Same Monthly set up but reversed
Conservative Target 0.8716
Technical Target 0.5610...

$EurUsd Yearly Chart
Price broke out of an 8 year range in 2015 & spent the last 6 /7 years correcting & re-testing the breakout
A conservative target of 1x previous moves gets us to 0.6687.
Again, were I trading it short term I'd be almost certain of getting that prior low...
Price broke out of an 8 year range in 2015 & spent the last 6 /7 years correcting & re-testing the breakout
A conservative target of 1x previous moves gets us to 0.6687.
Again, were I trading it short term I'd be almost certain of getting that prior low...

The chart that needs no introduction... $UsdJpy Monthly
It doesn't get more Bullish than this. New trends forming on multiple time horizons.
The BOJ are buying bonds like they're going out of fashion. But if there is a crash, wont $JPY get bid?...
It doesn't get more Bullish than this. New trends forming on multiple time horizons.
The BOJ are buying bonds like they're going out of fashion. But if there is a crash, wont $JPY get bid?...

Interestingly an important High sits between the 1x & 2.618x targets for the smaller trend
147.65 is the price $UsdJpy rallied to in 1998 before Russia defaulted on its debt & markets crashed
Amazingly, a 145.65 $UsdJpy & a Russian Debt Default are currently both possible...
147.65 is the price $UsdJpy rallied to in 1998 before Russia defaulted on its debt & markets crashed
Amazingly, a 145.65 $UsdJpy & a Russian Debt Default are currently both possible...
I question whether we once again trade into the 147.65 high in #UsdJpy just as something truly breaks. This will be an interesting one to watch
Just imagine if $UsdJpy traded into 145.65 & markets crashed on a Russian Debt Default again...
Just imagine if $UsdJpy traded into 145.65 & markets crashed on a Russian Debt Default again...
You can see on the $UsdJpy Yearly Chart..
The Higher Degree breakout (New Trend) is in fact an Inverse Head & Shoulders dating back to the Russian Financial Crisis
A 1x move (textbook H&S Target) takes us right back to the previous '78 low of 177.30
138-148 isn't crazy here...
The Higher Degree breakout (New Trend) is in fact an Inverse Head & Shoulders dating back to the Russian Financial Crisis
A 1x move (textbook H&S Target) takes us right back to the previous '78 low of 177.30
138-148 isn't crazy here...

$GbpUsd Monthly
This is arguably the worst one.
Forget 2.618 targets, a conservative 1x Target gets us to 0.8451!
All the people who tried to trade this as a Double Bottom on the March 2020 spike low are now scrambling to get out having watched it fail to make a new high...
This is arguably the worst one.
Forget 2.618 targets, a conservative 1x Target gets us to 0.8451!
All the people who tried to trade this as a Double Bottom on the March 2020 spike low are now scrambling to get out having watched it fail to make a new high...

The ones who bought #GbpUsd higher up >1.3000 are now underwater & refuse to accept a loss. They are going to hold tight praying to the market gods until their stops get taken out at 1.1414
At which point new traders will add short positions & breakout mechanics kick in again...
At which point new traders will add short positions & breakout mechanics kick in again...
$GbpUsd Yearly Chart gets worse
This is the chart that caused me to change my own $Gbp into $Usd a while ago
The new Monthly trend is from a re-test of a 20 year H&S with the overall consolidation going back 30 years!
Both 1x Target & Technical H&S Target are about -55% /0.600
This is the chart that caused me to change my own $Gbp into $Usd a while ago
The new Monthly trend is from a re-test of a 20 year H&S with the overall consolidation going back 30 years!
Both 1x Target & Technical H&S Target are about -55% /0.600

Same signs in EM - $UsdPln Quarterly Chart
Notice the traders who shorted resistance, only to see price fail to make a new low.
Now notice the big "explosive move" through the High as they covered their shorts
Breakout mechanics at work
This *despite Polish CB intervention...
Notice the traders who shorted resistance, only to see price fail to make a new low.
Now notice the big "explosive move" through the High as they covered their shorts
Breakout mechanics at work
This *despite Polish CB intervention...

Conservative Target = 5.3
Technical Target = 6.9
Again, I can't predict the future, but I can tell you how large trends begin. They begin like this...
Technical Target = 6.9
Again, I can't predict the future, but I can tell you how large trends begin. They begin like this...
$UsdNok Yearly Chart
The 2020 Covid Crash caused a multi decade breakout in #UsdNok
For 35 years this pair has tried to make a new low below the '78 low. It failed
A brand new Bull market was born in 2020
No follow through for the 9.835 shorts. They are now short covering...
The 2020 Covid Crash caused a multi decade breakout in #UsdNok
For 35 years this pair has tried to make a new low below the '78 low. It failed
A brand new Bull market was born in 2020
No follow through for the 9.835 shorts. They are now short covering...

$UsdSek Quarterly Chart
A 14 year Inverse Head & Shoulders broke in 2016
Twice sellers tried to sell resistance. The previous attempt failed to make a new low & you can see from the recent momentum those same sellers are now scrambling to get out
Breakout mechanics at work...
A 14 year Inverse Head & Shoulders broke in 2016
Twice sellers tried to sell resistance. The previous attempt failed to make a new low & you can see from the recent momentum those same sellers are now scrambling to get out
Breakout mechanics at work...

These are just some of the clearer set ups which point to a significant & imminent strengthening of $Dxy
Fundamentally I'm bearish on the Global Economy & as followers will know I tweeted on March 6th that a recession was coming
These charts confirm that Macro outlook IMO
Fundamentally I'm bearish on the Global Economy & as followers will know I tweeted on March 6th that a recession was coming
These charts confirm that Macro outlook IMO

The reason for this thread *now* then is not only are we at the point of major $Dxy breakouts, we also have a big, fundamentally Bullish #Usd catalyst - a potential Global Recession
It's precisely when major technicals & major fundamental drivers align that you get major moves..
It's precisely when major technicals & major fundamental drivers align that you get major moves..

In summary, whilst I don't have a crystal ball, the alignment of major US #Dollar technical breakouts & a potential Global Recession puts many of these 1x Targets into play
Charts posted above show new trends forming, but there are many signs of unusual $Dxy strength...
$UsdCnh
Charts posted above show new trends forming, but there are many signs of unusual $Dxy strength...
$UsdCnh

$UsdZar Weekly
1.5 year Inverse H&S Breakout
Sellers tried to short back below the neckline, now they're scrambling to cover the shorts having failed to drive price lower. New buyers step in
Breakout mechanics at work
1x Target +9%
But previous high in play @ $19/+20%
END
1.5 year Inverse H&S Breakout
Sellers tried to short back below the neckline, now they're scrambling to cover the shorts having failed to drive price lower. New buyers step in
Breakout mechanics at work
1x Target +9%
But previous high in play @ $19/+20%
END

• • •
Missing some Tweet in this thread? You can try to
force a refresh


