Root πŸ₯• Profile picture
May 13, 2022 β€’ 8 tweets β€’ 4 min read β€’ Read on X
1/8 Why the April 2021 top could be seen as the real bull market cycle top. #Bitcoin
πŸ§΅πŸ‘‡
2/8 I've been posting charts comparing the #Bitcoin cycles aligned by ATH's using the April 2021 top and get obviously many comments saying that "November is the ATH".
Although a case could be made to use November, in this thread I'll explain why I believe April might be better.
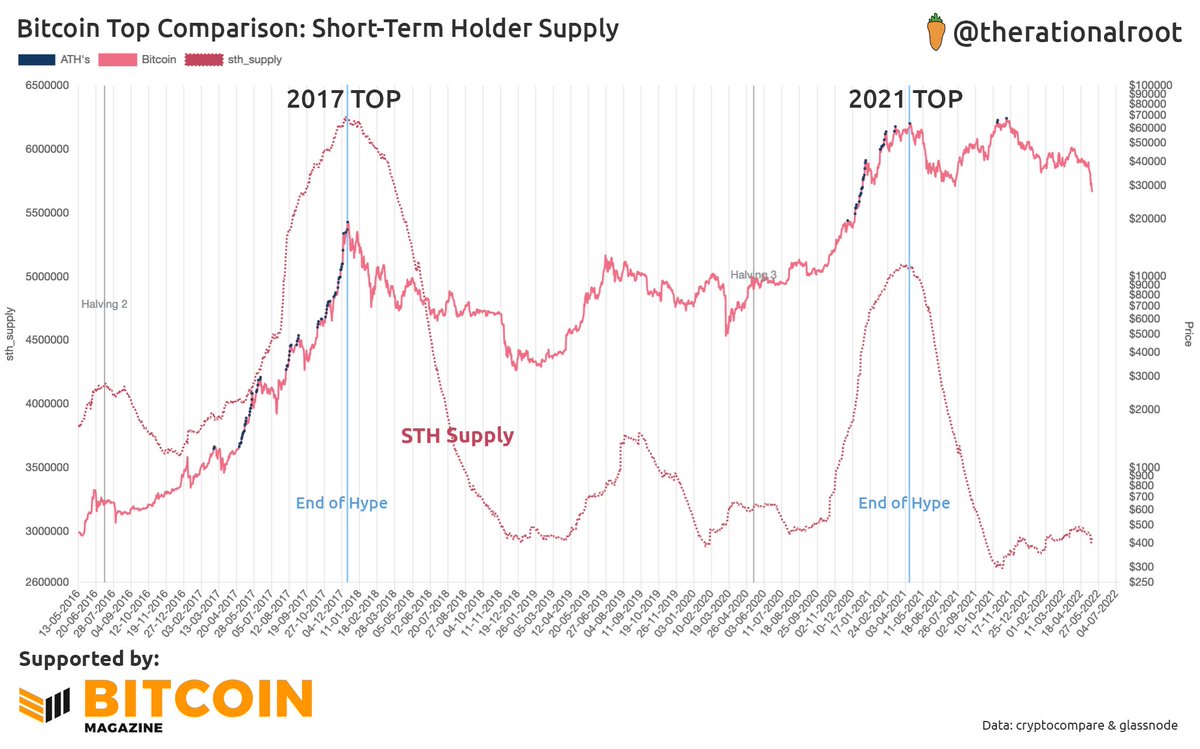
3/8 Most on-chain but also traditional indicators show a top in April rather than November.
Looking at #Bitcoin's supply we see that the first peak of 2021 has an enormous increase in Short-term Holder supply while the second has none.
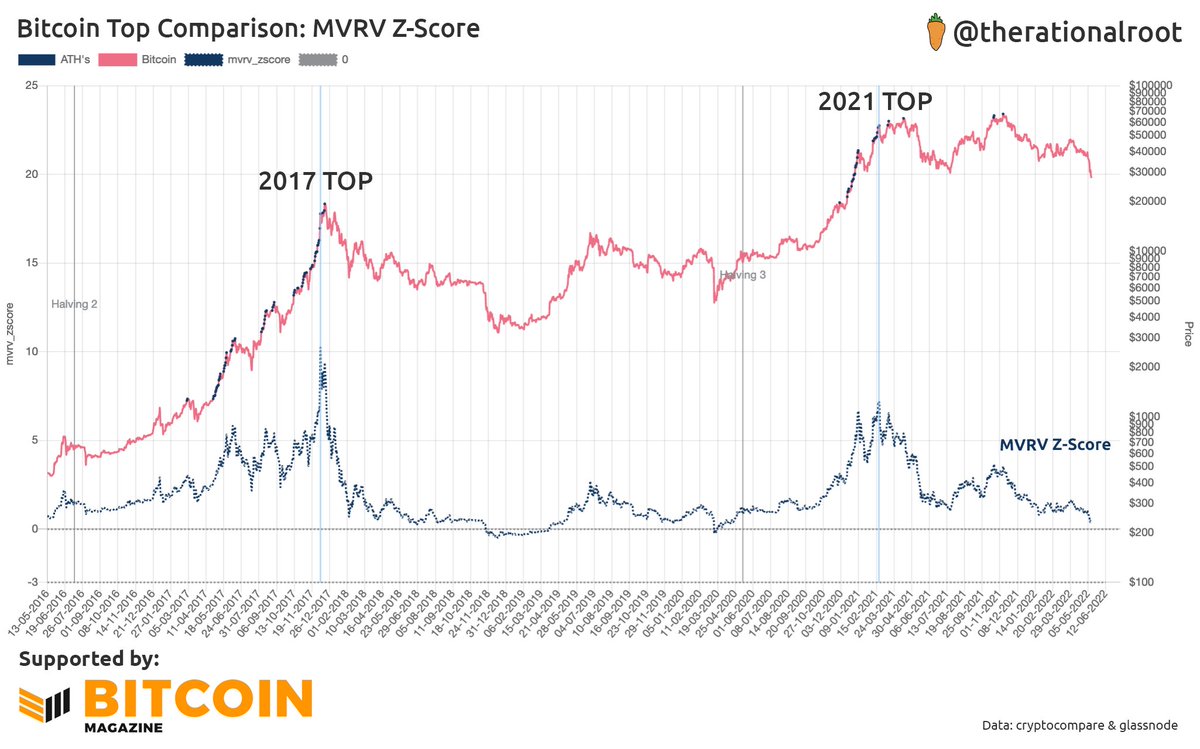
4/8 If we look at MVRV Z-Score which compares the distance between the Market Cap and the Realized Cap (the sum of the on-chain price of all #Bitcoin), we again see a peak in the first top of 2021.
5/8 Also traditional indicator such as the RSI show that we peaked in the first top of 2021 and are currently reaching lows.
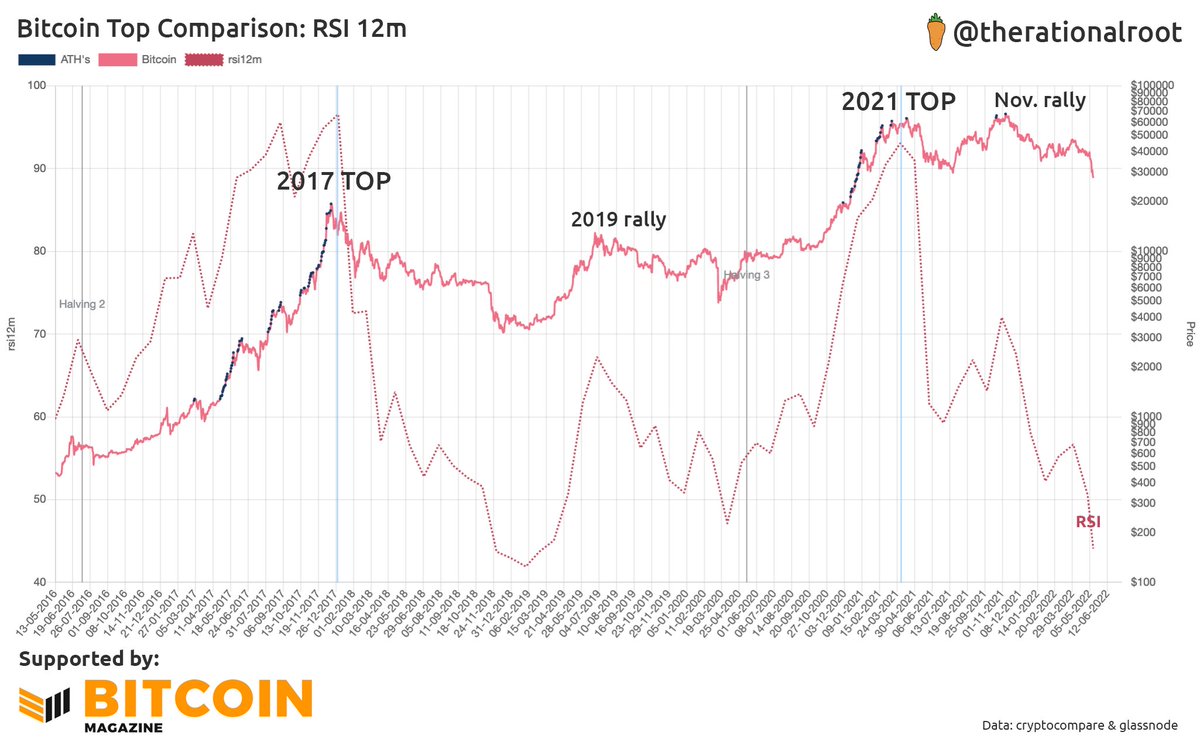
6/8 Note how the 2019 and November 2021 rally are very similar. Both were mostly based on LTH's although 2019 also had a slight increase in STH Supply.

Based on the above we can now divide the market into bull and bear segments from the previous ATH until the "new ATH".
7/8 The November 2021 ATH was actually a higher high based on a LTH rally that came early, whereas in the 2017 cycle we had it after the bear bottom.
It's also noticeable how the bull market of 2021 was quite short. #Bitcoin
8/8 It's not only promising how we made an ATH based on LTH conviction in bear market conditions but also that we've already been consolidating for over a year increasing our chances that a bottom is near.

Thanks for making it to the end!

β€’ β€’ β€’

Missing some Tweet in this thread? You can try to force a refresh
γ€€

Keep Current with Root πŸ₯•

Root πŸ₯• Profile picture

Stay in touch and get notified when new unrolls are available from this author!

Read all threads

This Thread may be Removed Anytime!

PDF

Twitter may remove this content at anytime! Save it as PDF for later use!

Try unrolling a thread yourself!

how to unroll video
  1. Follow @ThreadReaderApp to mention us!

  2. From a Twitter thread mention us with a keyword "unroll"
@threadreaderapp unroll

Practice here first or read more on our help page!

More from @therationalroot

Mar 11, 2024
Chart thread! Here are the charts I used on my recent @WhatBitcoinDid appearance.

37,000+ views on YouTube! 🧑πŸ”₯

πŸ§΅πŸ‘‡
Image
Read 17 tweets
Jul 31, 2023
The 4-year cycle is on point!
Each cycle consists of 3 phases. πŸ§΅πŸ‘‡
#Bitcoin Image
2/ The 4-year spiral chart is my go-to for discussing timing in #Bitcoin. The color-coded chart reflects unrealized profit and losses, unveiling cycle patterns.
3/ We're 6 months into the recovery phase/early bull market. Young transactions, aka Short-Term Holders (STH's) offer crucial signals, profoundly impacted by current price action.
Read 4 tweets
Jun 16, 2023
@WhatBitcoinDid 🧡Here are the slides/charts we cover: Image
Read 22 tweets
Sep 5, 2022
Slides used with @PeterMcCormack @WhatBitcoinDid.
Hope you enjoy the podcast/youtube!
πŸ§΅πŸ‘‡ Image
Spiral based on Halvings/blocks. #Bitcoin Image
Time based Spiral, 4 year cycle. #Bitcoin Image
Read 22 tweets
Aug 23, 2022
"#Bitcoin ready for major leg down to 9k 😱"

I've seen this chart doing the rounds, time to discuss some misconceptions πŸ§΅πŸ‘‡
First, let's zoom out to provide some context where we're coming from.
Two things stick out immediately:
1. We really went sideways into this All-Time-High alignment.
2. We're comparing previous pointy blow-off tops to a flat distribution top.
Not saying above chart isn't valid, however it's the most bearish alignment possible and imo an unlikely outcome considering the points just made. Now let's chop through both points in further detail.
Read 14 tweets
May 25, 2022
Perhaps the most important chart in #Bitcoin currently!

For the past months we've had LTH capitulation ⁠— shown by the rapidly falling LTH Cost Basis.πŸ‘‡

An uptick is a first sign that LTH’s might have stopped capitulating! Note: early signal, but finally a change in trend!
Context: The LTH Cost Basis is the average purchase price of all LTH's. While we had STH capitulation earlier this year, the drawdown of past months was mostly caused by LTH’s as the Cost Basis declining means more recent LTH's where selling coins purchased at higher prices.
LTH Spent Price is the average price at which LTH's bought the coins they're currently spending.

There are a limited amount of LTH's that have an average purchase price of 33k, namely the ones that bought in the tops. The question is: did we run out yet?
The past 6 days we did!
Read 4 tweets

Did Thread Reader help you today?

Support us! We are indie developers!


This site is made by just two indie developers on a laptop doing marketing, support and development! Read more about the story.

Become a Premium Member ($3/month or $30/year) and get exclusive features!

Become Premium

Don't want to be a Premium member but still want to support us?

Make a small donation by buying us coffee ($5) or help with server cost ($10)

Donate via Paypal

Or Donate anonymously using crypto!

Ethereum

0xfe58350B80634f60Fa6Dc149a72b4DFbc17D341E copy

Bitcoin

3ATGMxNzCUFzxpMCHL5sWSt4DVtS8UqXpi copy

Thank you for your support!

Follow Us!

:(