
#Bitcoin On-chain & Cycle analyst.
Supported by @BitcoinMagazine & @btcdirect.
Building the Bitcoin Strategy Platform & Newsletter.

 2/ The 4-year spiral chart is my go-to for discussing timing in #Bitcoin. The color-coded chart reflects unrealized profit and losses, unveiling cycle patterns.
 Spiral based on Halvings/blocks. #Bitcoin
 First, let's zoom out to provide some context where we're coming from.
 Context: The LTH Cost Basis is the average purchase price of all LTH's. While we had STH capitulation earlier this year, the drawdown of past months was mostly caused by LTH’s as the Cost Basis declining means more recent LTH's where selling coins purchased at higher prices.
 2/8 I've been posting charts comparing the #Bitcoin cycles aligned by ATH's using the April 2021 top and get obviously many comments saying that "November is the ATH".
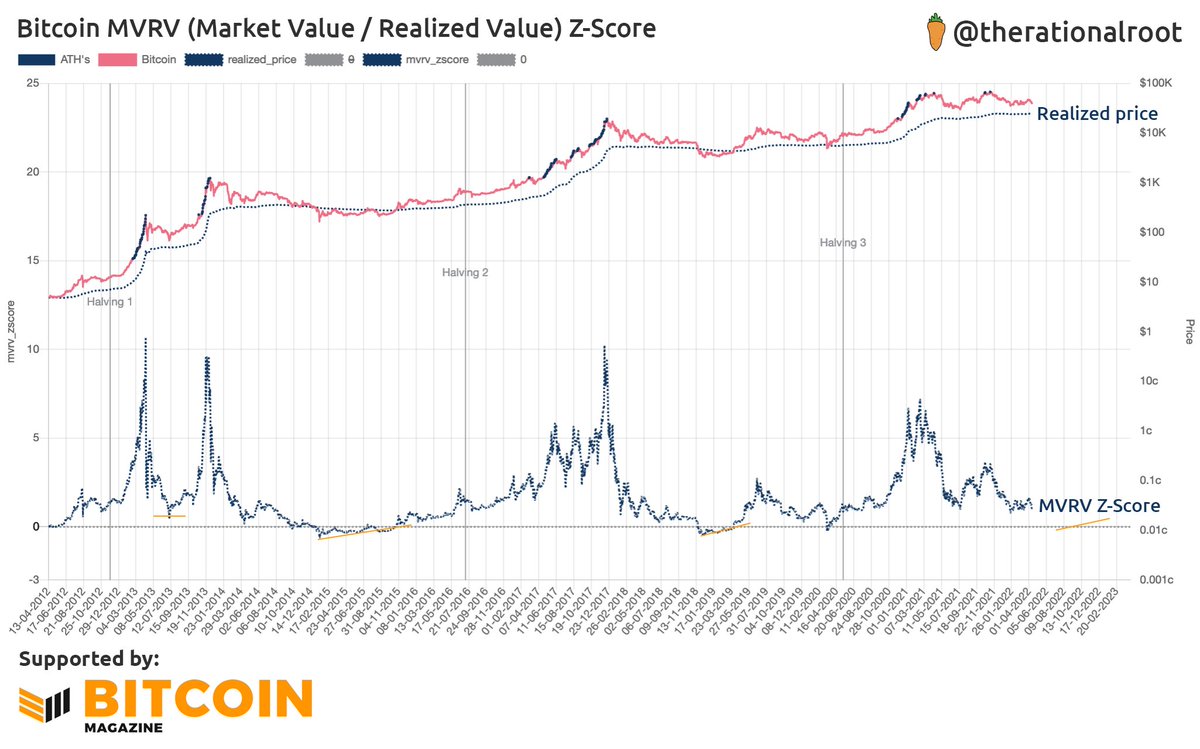 First, what does MVRV Z-score mean? MVRV shows the distance between the Market Cap (Value) vs. Realized Cap (Value). This is the same thing as the z-score distance between Price vs. Realized Price. For MVRV Z-Score to go below zero means that price should go below realized price.

 Below thread is a summary of the full article 👇
 2/ What is the idea behind the Floor and Mezzanine?
 Thanks to @ultravirtu for bringing the Asian sell-pressure to our attention.
 It took a month longer than in 2013 for the trend to change as this time we had 3 consecutive months in a downtrend making a low on June's close.
 Most on-chain indicators show we are undervalued for some time now. We can't rule out that we might go lower, although, if we do most likely it will be a spike down.
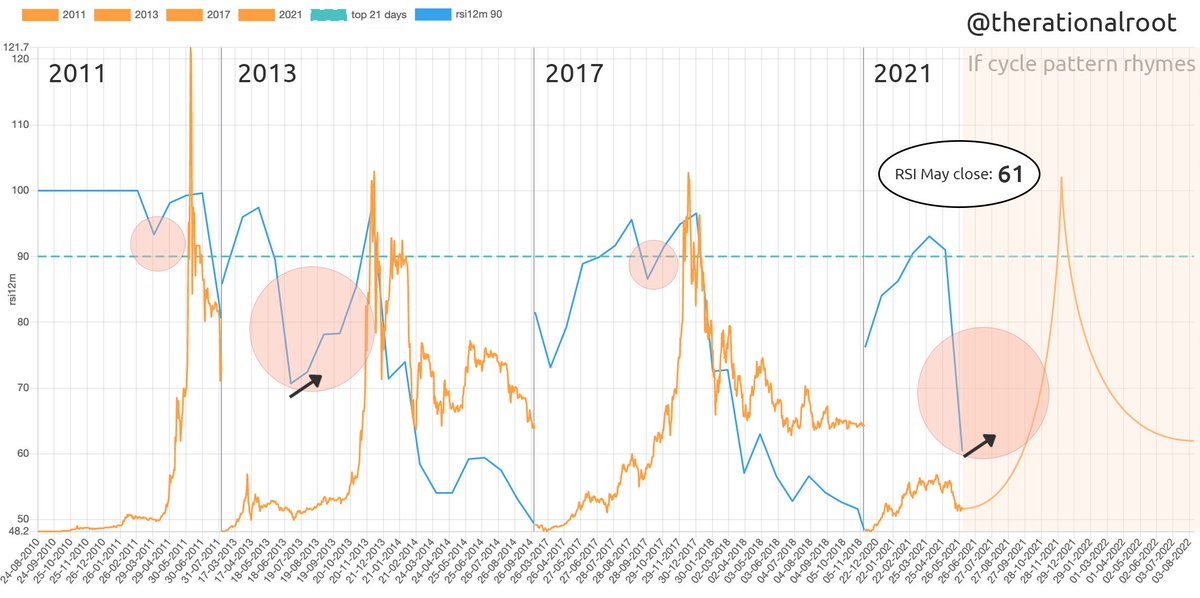 The drop below 90 was expected; however, May’s close was surprisingly low.
 Measuring from the previous ATH this cycle took 28,5% longer the reach the mid-cycle dip (assuming that the low is in). If we continue the same trend as previous cycles at this slower pace, the ATH would be on 6 Dec 2021.
 We are comparing each bull market by taking an aggregate of the days that we have been exploring/discovering new ATH’s aka the most bullish days of #bitcoin when FOMO is at peak levels.
 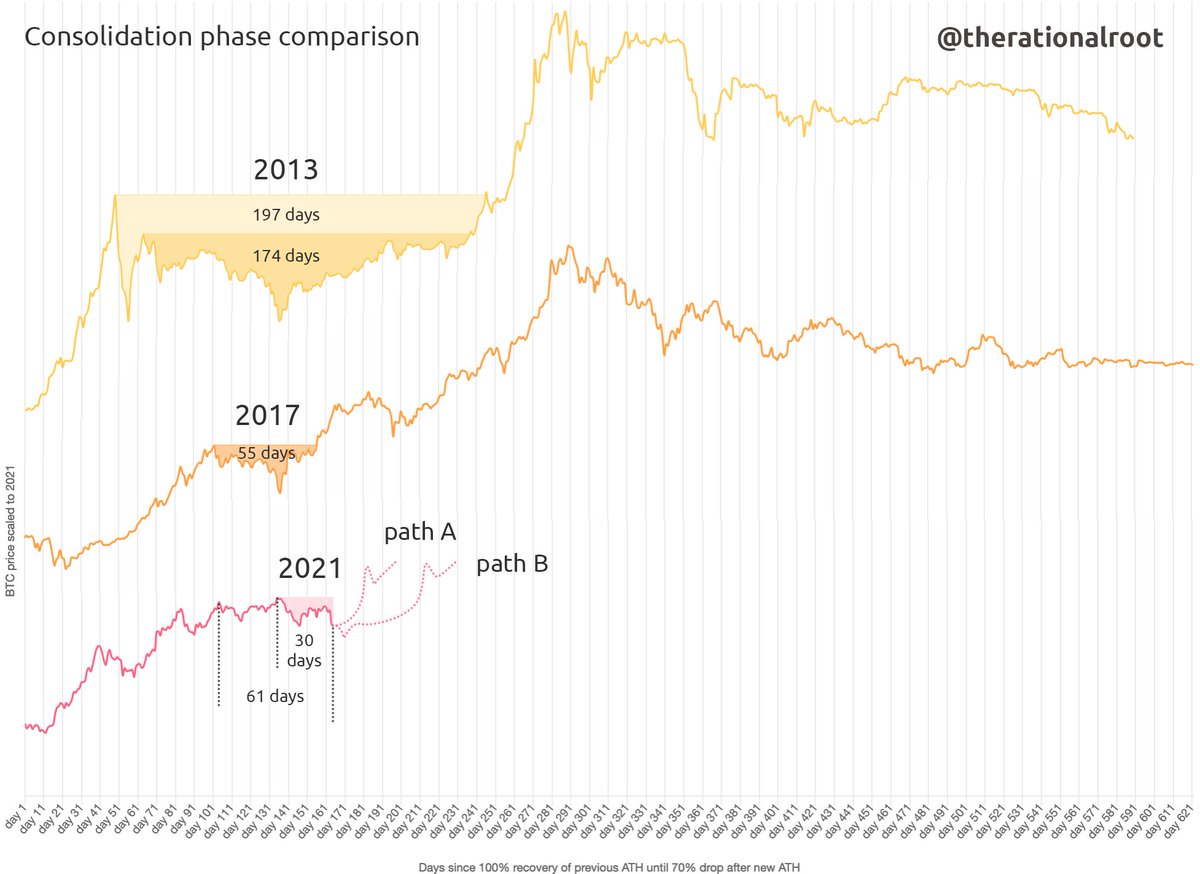 Another month at the very least (even 2) would be totally normal! Initially I drew path A but maybe path B might be more likely now. This also aligns with an RSI monthly close below 90 (more on this below).

