New #CBECI update! 🚨
Among others, new mining map data covering the period from Sep 2021 to Jan 2022 included confirms the rise of the USA as the world's dominant mining hub, now extending its lead to 37.84% of total hashrate amidst the global recovery.
ccaf.io/cbeci/index
Among others, new mining map data covering the period from Sep 2021 to Jan 2022 included confirms the rise of the USA as the world's dominant mining hub, now extending its lead to 37.84% of total hashrate amidst the global recovery.
ccaf.io/cbeci/index

But the most notable finding has been the resurgence of China as a major mining hub which – despite the government ban in June 2021 – is reported to host 21.11% of the world's total hashrate.
This seems to empirically confirm what industry insiders have suggested for a while:
This seems to empirically confirm what industry insiders have suggested for a while:
A non-trivial part of China's hashrate has never left the country and instead went underground to operate covertly through various means.
@KenzieSigalos offered an excellent account of this practice in December 2021: cnbc.com/2021/12/18/chi…
@KenzieSigalos offered an excellent account of this practice in December 2021: cnbc.com/2021/12/18/chi…
Why did China's *reported* share immediately dropped to 0 following the ban, then?
https://twitter.com/mrauchs/status/1448216953659838464
The answer lies in methodological trade-offs arising from our top-down approach based aggregated geolocational data reported by partnering mining pools @btccom_official, @FoundryServices, @officialpoolin, and @ViaBTC.
jbs.cam.ac.uk/insight/2022/b…
jbs.cam.ac.uk/insight/2022/b…
No methodology is perfect, but the analysis remains useful as long as the trade-offs are well understood. Generally, we believe the underlying assumptions to be sufficiently robust most of the time given the financial costs of latency.
Only during extreme 'shock' events, like the politically-mandated ban on the mining industry, these assumptions may not temporarily hold true.
As always, we are open to exploring alternative options – please get in touch if you'd like to contribute: ccaf.io/contact?topic=….
As always, we are open to exploring alternative options – please get in touch if you'd like to contribute: ccaf.io/contact?topic=….
Kazakhstan (13.22%) and Russia (4.66%) have lost significant market share, with Canada (6.48%) only moderately growing its total capacity. 

What else has changed?
Among others, the US now has its own regional mining map, although initially limited to the month of December 2021.
Among others, the US now has its own regional mining map, although initially limited to the month of December 2021.

We have also updated the mining hardware list underlying the CBECI power demand model to ensure that the sample accurately reflects the current state of the industry.
Among others, we removed 'exotic' devices with little sales and restricted the lifetime of machines to 5 years.
Among others, we removed 'exotic' devices with little sales and restricted the lifetime of machines to 5 years.
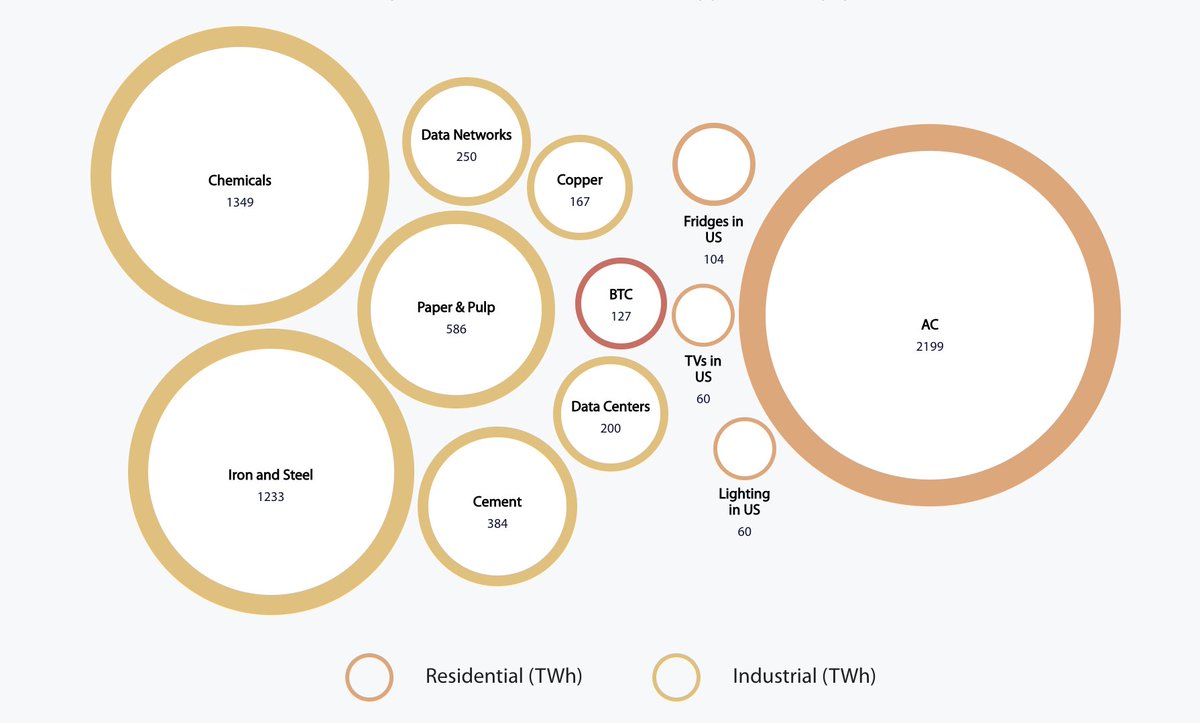
We also listened to feedback from the #Bitcoin community, such as adjusting the bubble sizes of the comparative chart below to scale.
A list of all changes can be found here: ccaf.io/cbeci/index/co…
A list of all changes can be found here: ccaf.io/cbeci/index/co…

As always, we will continue to work with our partners and network to bring further improvements to the tool and are inviting constructive feedback and suggestions from the ecosystem.
Please get in touch! 🙂
ccaf.io/contact?topic=…
Please get in touch! 🙂
ccaf.io/contact?topic=…
Longer form analysis about the update: jbs.cam.ac.uk/insight/2022/b…
• • •
Missing some Tweet in this thread? You can try to
force a refresh


